Fig. 1
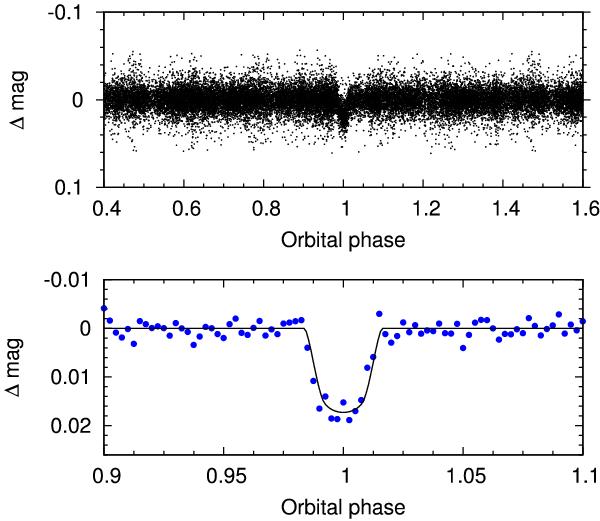
WASP-South discovery light curve. Upper panel: photometry folded on the orbital period of P = 3.4 d. Points with error above three times the median error (0.012 mag) were clipped for display purposes. Lower panel: photometry folded on the orbital period and binned in phase (Δφ = 0.025), with the transit model generated from the parameters of Table 4 superimposed.
Current usage metrics show cumulative count of Article Views (full-text article views including HTML views, PDF and ePub downloads, according to the available data) and Abstracts Views on Vision4Press platform.
Data correspond to usage on the plateform after 2015. The current usage metrics is available 48-96 hours after online publication and is updated daily on week days.
Initial download of the metrics may take a while.