Fig. 4
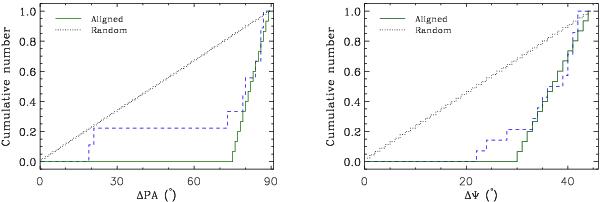
The distribution in the difference between spectropolarimetrically predicted disk PA and observed disk PA for the sample presented in Table 3 (blue dashed). This is compared to a random distribution (black short dotted). On the left we show a distribution where polarisation signatures are always orientated perpendicularly to circumstellar disks and on the right we present the distribution for a scenario where the spectropolarimetric signatures can be either perpendicular or parallel to disks (see the text for more detail). Both model distributions have a maximum error of 15°. In both cases, a random orientation of disk and polarisation position angles can be discarded at the 3σ level.
Current usage metrics show cumulative count of Article Views (full-text article views including HTML views, PDF and ePub downloads, according to the available data) and Abstracts Views on Vision4Press platform.
Data correspond to usage on the plateform after 2015. The current usage metrics is available 48-96 hours after online publication and is updated daily on week days.
Initial download of the metrics may take a while.