Fig. 4
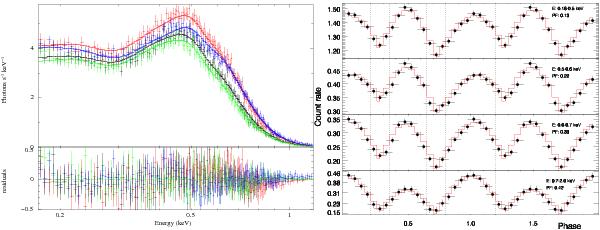
X-ray spectra including primary and secondary peaks, first and second minima, and phase-folded light curves in different energy bands of RBS 1223 combined from 12 pointed XMM-Newton EPIC pn observations. Fitted absorbed blackbody with Gaussian absorption-line models (phabs*bbodyrad*gabs XSPEC) to the spectra and two sinusoids to the phase-folded light curves are also shown (for details, see text and Table 2). Dotted vertical lines indicate the phase intervals used for the extraction and fitting of spectra shown in the left panel.
Current usage metrics show cumulative count of Article Views (full-text article views including HTML views, PDF and ePub downloads, according to the available data) and Abstracts Views on Vision4Press platform.
Data correspond to usage on the plateform after 2015. The current usage metrics is available 48-96 hours after online publication and is updated daily on week days.
Initial download of the metrics may take a while.