Fig. A.1
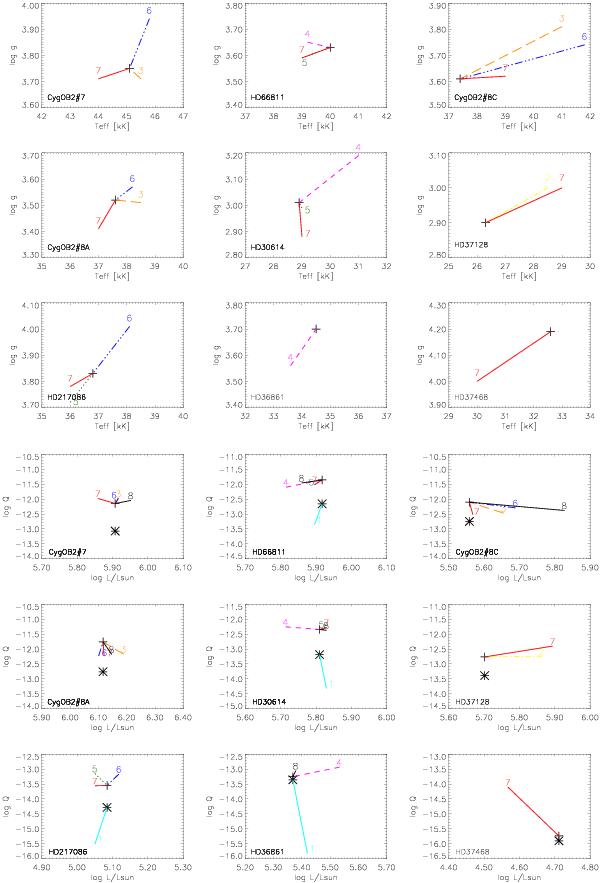
Comparison of the results obtained in this work (crosses) with results from other investigations (for data and reference identifiers, see Table A.2). Upper 3 × 3 panels: log g vs. Teff; all panels have the same scale, corresponding to an extent of 5000 K in Teff and 0.4 dex in log g. Lower 3 × 3 panels: log Q vs. log (L/L⊙), with axes extending over 0.4 dex in log (L/L⊙) and 3.5 dex in log Q. In order to facilitate the comparison with ρ2-diagnostics, all Q values have been normalized to fv = 1 (see Eq. (A.1)). The asterisks provide the Qres-values which have to be compared with the corresponding values from ref# 1 (Fullerton et al. 2006, ρ-diagnostics, but including the product with the ionization fraction of Pv). Note that all Qres values have been scaled by a factor of 10 to fit into the individual figures.
Current usage metrics show cumulative count of Article Views (full-text article views including HTML views, PDF and ePub downloads, according to the available data) and Abstracts Views on Vision4Press platform.
Data correspond to usage on the plateform after 2015. The current usage metrics is available 48-96 hours after online publication and is updated daily on week days.
Initial download of the metrics may take a while.