| Issue |
A&A
Volume 535, November 2011
|
|
|---|---|---|
| Article Number | A51 | |
| Number of page(s) | 8 | |
| Section | Interstellar and circumstellar matter | |
| DOI | https://doi.org/10.1051/0004-6361/201117115 | |
| Published online | 03 November 2011 | |
Laboratory spectroscopic studies of the collisions between slow H+, H2+, H3+ ions and molecular nitrogen
Institute of Experimental Physics, University of Gdansk,
ul. Wita Stwosza 57,
80-952
Gdansk,
Poland
e-mail: This email address is being protected from spambots. You need JavaScript enabled to view it.
Received:
20
April
2011
Accepted:
7
August
2011
Abstract
Luminescence in the 275–470 nm spectral region was observed in the collisions of H+, H2+, and H3+ with N2 in the 10–1000 eV projectile energy range. For all the systems, a luminescent charge exchange leads to the electronically excited states of N2+(B2Σu) and N2(C2Πu, G2Δg). Computer simulation of the spectra was used to estimate relative cross sections for the reactions, as well as the temperatures corresponding to population distributions of vibrational and rotational levels of the products. The vibrational temperatures of the products for the H2++N2 and H3++N2 collision systems are found to be changing significantly with the projectile velocity, increasing from 1500 K at the lowest projectile velocities (≤50 km s-1) and going through a maximum (15 000 K) at about 80 km s-1, to decrease rapidly with increasing velocity, down to 3000 K. The H++N2 collision system, however, does not show a similar increase in temperature. The increase in vibrational temperature indicates that, for velocities in the 50–1000 km s-1 range, the charge transfer process is the non-Franck-Condon type, a model that assumes a change in the internuclear distance of target molecule by the incident ion before electron capture occurs. This vibrational temperature dependency could be used to infer the ion velocity producing the observed emission of N2+. Also we found no evidence of any formation of excited NH molecules in these reactions.
Key words: astrochemistry / ISM: abundances / ISM: molecules / methods: laboratory
© ESO, 2011
1. Introduction
The interaction of the stellar wind and interstellar medium is of strong interest to cosmochemistry. Nitrogen is the fifth most abundant element in the Solar System (Arnett 1996) and the seventh in Milky Way Galaxy (Croswell 2000). According to interstellar chemistry models, nitrogen should mainly be in a molecular form (N2). Nevertheless, it has not have been observed directly for a long time (neither in absorption nor emission). The first direct observation of molecular nitrogen in the interstellar media was achieved at far-ultraviolet absorption towards the HD 124314 star with the help of the Far Ultraviolet Spectroscopic Explorer (FUSE) (Knauth et al. 2004).
Before that, ionized molecular nitrogen has been observed in the emission of bright comets
approaching the Sun. Comets are important, because they could contain information about an
early protosolar cloud. The N spectra were observed spectroscopically in comet Halley (Wyckoff & Theobald 1989) or Scorichenko-George (1989e1) (Churyumov & Chorny 1992). There are comets where
no N has
been detected: comet C/2002 C1(Ikeya-Zhang) (Cochran
2002), or comets 122P/1995 S1(deVico) and C/1995 O1 (Hale-Bopp) (Cochran et al. 2000). From spectroscopic observations the
N/CO+
ratio or upper limit for this ratio was estimated as very low. The investigations of the
excitation conditions in comets leading to the observed
N bands
could be useful for more accurate determination of the N2 abundance. Recently,
the N
emission was observed in a bright meteor Leonid fireball (Shinsuke et al. 2005).
spectra were observed spectroscopically in comet Halley (Wyckoff & Theobald 1989) or Scorichenko-George (1989e1) (Churyumov & Chorny 1992). There are comets where
no N has
been detected: comet C/2002 C1(Ikeya-Zhang) (Cochran
2002), or comets 122P/1995 S1(deVico) and C/1995 O1 (Hale-Bopp) (Cochran et al. 2000). From spectroscopic observations the
N/CO+
ratio or upper limit for this ratio was estimated as very low. The investigations of the
excitation conditions in comets leading to the observed
N bands
could be useful for more accurate determination of the N2 abundance. Recently,
the N
emission was observed in a bright meteor Leonid fireball (Shinsuke et al. 2005).
Stars emit a constant stream of particles (Lamers &
Cassinelli 1999), mainly protons (H+) and electrons, along with other
elements with abundances a few orders of magnitude smaller (Geiss et al. 1994). Gruntman (1996) has
analyzed the possibility of forming the H ion
flux; the solar wind ionize and pickup encountered in heliosphere or in local interstellar
medium H2 molecule, or due to outgassing of interplanetary dust.
The stellar wind can be gentle (as for the Sun) and difficult to detect from the Earth. However, the intensity and dynamics vary significantly between different stars. A star like the Sun exhibits a stellar wind with particles velocities between 200 km s-1 from solar surfaces and 700 km s-1 from coronal holes (Böhm-Vitense 1989). Cooler stars, typically red giants, produce winds with lower velocities (about 20 km s-1), while hot stars exhibit much stronger winds with speeds up to 2000 km s-1 (Lamers & Cassinelli 1999). Also the stellar wind changes during the life of a star.
The energetic protons in the stellar wind interact with the molecules encountered (in interstellar cloud, comet entourage, or atmosphere) and are transformed into excited neutral hydrogen atoms by charge exchange collisions with molecular cloud, and they also produce various excited components.
In this paper, the collisions of the H+,
H, and
H hydrogen ions with molecular nitrogen N2 are studied at collision energies below
1000 eV. Because N2 in the excited states may have enhanced chemical reactivity,
as well as characteristic radiation, these reactions are important because of their strong
role in the synthesis of molecular species in dense interstellar media. The relevant
velocities of the charged particles in this paper are similar to the one ejected by the Sun,
in the range of 30 km s-1 to 430 km s-1.
hydrogen ions with molecular nitrogen N2 are studied at collision energies below
1000 eV. Because N2 in the excited states may have enhanced chemical reactivity,
as well as characteristic radiation, these reactions are important because of their strong
role in the synthesis of molecular species in dense interstellar media. The relevant
velocities of the charged particles in this paper are similar to the one ejected by the Sun,
in the range of 30 km s-1 to 430 km s-1.
Besides Earth, there are only three objects in the Solar System that contain molecular
nitrogen in their atmosphere. Titan, the largest moon of Saturn, Triton (the largest moon of
the planet Neptune) and Pluto have atmospheres that are mainly composed of molecular
nitrogen. The solar wind may cause the auroral emission, leading to a spectacular light
phenomenon. These systems (H+, H,
H+N2)
have been studied in the past, but only a few of them present emission spectra and cross
section data below the 1000 eV collision energy range.
Hydrogen ions interacting with N2 molecules have been studied spectroscopically by observing hydrogen radiation of Balmer series Hβ(486.1 nm) in the 3–10 keV energy range (Lee & Lin 2002) and Hα(656.3 nm) emission in the 3–100 keV energy range (Yousif et al. 1986). The absolute emission cross sections for the Hβ and Hα lines are around 10-17 cm2.
Using the time-of-flight technique, Luna et al.
(2003) have measured electron capture and ionization cross sections for the
incident of H+ on N2 in the 10–100 keV energy range. The values
obtained are close to 10-16 cm2. With the same technique Hasan (2005) measured the total cross sections for
collisions of H ions
with an N2 molecule in the 700–2000 eV energy range, obtaining values on the
order of 10-16 cm2. Using a mass-spectrometric technique Browning & Gilbody (1968) also measured cross
section for formation of various ions in the H++N2 collision in the
5–45 keV energy range. From their studies it follows that electron capture process
dominates, and the N
production is 2 to 3 orders of magnitude more efficient than
N or
than dissociation into N+ ions.
or
than dissociation into N+ ions.
Lee & Suen (1998) spectroscopically studied
the N(B-X)
first negative system excitation in the uv-visible spectrum between 300 and 450 nm that is
induced by bombardment of molecular nitrogen by the H+,
H and
H
hydrogen ions in the 2–10 keV energy range. They measured the cross section for the emission
of the (0, 0) band at 391.4 nm and (0, 1) band at 427.8 nm of the
N first
negative system. Additionally, the I(0, 0)/I(0, 1)
branching ratio of the N(B-X)
was measured as a function of ion energy. The emission cross sections for low-energy
(63–2500 eV) H+ and H impacting on N2 have been measured by Van Zyl et al. (1983).
Interaction of molecular nitrogen with other ions was also investigated using spectroscopic
techniques. Ottinger & Simonis (1978) studied
the charge transfer of C+, N+, and O+ ions in metastable
and ground states with N2 at 1000 eV energy. Bearman et al. (1976) measured the cross section for charge transfer collision
between the He+, He ions,
and N2 at 11 eV energy. In both papers the high resolution spectra show changes
in vibrational state distribution. The light emission in the 200 to 500 nm range and a cross
section at 10–20 eVCM of the Ar2++N2 reaction have been
measured in Neuschäfer et al. (1979).
This paper presents the results of collisional excitation of the nitrogen molecule in the
reactions of the H+, H and
H with
N2 below 1000 eV energy in single-collision conditions. The luminescence from
the UV to the visible light (270–470 nm) was obtained at various energies. Experimental
results are supported by the computer simulations, which allow identifying the products
arisen in the reactions studied and moreover their relative abundances and population
distributions to be determined over rotational and vibrational levels.
2. Experiment
The experiment was performed in an ion beam – gas arrangement with the apparatus that is described in detail in Kowalski et al. (2004b). Basically, it is composed of an ion source, a mass spectrometer, a reaction cell, and an optical spectrometer.
Hydrogen ions were produced in a Colutron-type source, operating on H2 gas at a pressure of ~100 Pa. The anode-to-cathode voltage in a source was set to 100 V, and the discharge current was 0.5 A. These conditions of the source assured the highest intensity of the ion beam. Subsequently, hydrogen ions were extracted by a 1000 V potential to the primary mass spectrometer. Before entering the collision cell, ions were decelerated to the desired laboratory energy.
Light produced in the collision region was recorded with a 1024 channel “Mepsicron” detector connected to a McPherson 218 spectrograph, which was equipped with a 300 l/mm grating blazed at 500 nm. Each measurement simultaneously covered a spectral range of 200 nm. The spectral resolution was 1.5 nm FWHM. For an accurate identification of spectra components and determination of the population distribution over the rotational levels, high-resolution spectra were taken with a 1200 l/mm grating blazed at 250 nm, and the resolution was 0.25 nm FWHM. The pressure of the target gas was 15 mTr, as determined with a Barocel capacitance manometer.
The ion current measured behind the reaction cell during the measurements was approximately
0.2 nA at 50 eV, about 6 nA at 1000 eV for H+, and 50 nA for
H,
H at
1000 eV. The chemiluminescence signal (integrated over all 1024 detector channels) was
between 3 and 700 counts per second, depending on the current of the hydrogen ion beam. The
detector dark count rate integrated over all 1024 channels was 2 cts/s. The spectra were
taken at several different beam energies, ranging from 10 eVLAB (9.7, 9.3, and
9.0 eVCM for the H+, H, and
H ions,
respectively) to 1000 eVLAB (966, 933, and 903 eVCM for the
H+, H, and
H ions,
respectively).
3. Results
Examples of the recorded luminescence spectra for the H+,
H, and
H +
N2 collisions at ELAB = 1000 eV, 400 eV, 100 eV,
50 eV, and 10 eV are presented in Fig. 1. The light
accumulation times varied from 10 to 120 min per spectrum, depending on the signal
intensity. All spectra were smoothed over seven channels.
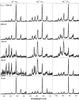 |
Fig. 1 Selected luminescence spectra for the H+ + N2,
H |
The energy dependence of the relative luminescence cross sections for the H+,
H, and
H+N2
collision systems are presented in Fig. 2. Only the
cross sections from ELAB = 1000 eV down to 50 eV are presented,
because the uncertainties are very high for lower energies.
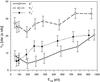 |
Fig. 2 Excitation functions for H+ + N2,
H |
The various complex processes in the reactions of hydrogen ions with the N2
molecule could result in the formation of different products (i.e.: H2,
N2, N, NH,
NH+, HN and
atomic H, N, N+) in diverse excited states, as well in the ground state. Reaction
products in the ground or metastable states are not detectable in our experiment. However,
excited products emitting in the UV-Vis range between 275 nm and 470 nm can be recorded.
To correctly identify products in the complex spectra, computer simulations are required
(Pranszke et al. 2011). From simulations we have
identified three main molecular emission bands in the observed region:
N(B – X
– X ),
N2(C
),
N2(C – B
– B ) and
N2(G
) and
N2(G – W
– W ). We also found
atomic emission of the hydrogen line of Balmer series, namely Hγ
(434.1 nm).
). We also found
atomic emission of the hydrogen line of Balmer series, namely Hγ
(434.1 nm).
An example of simulations for the H+N2
reaction at 400 eV is shown in Fig. 3a, where the
experimental spectrum and the best fit of the computer generated spectrum composed of
contributions from molecular emitters detected in the experiment are presented. The final
contour is a convolution of the following contours: N(B-X)
transition presented in Fig. 3b, N2(C-B)
transition presented in Fig. 3c, and N2(G-W)
shown in Fig. 3d, with weights proportional to the
intensity of each feature. The N(B – X) and
N2(C – B) systems have
clearly visible peak components indicated in Fig. 3b–d.
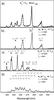 |
Fig. 3 a) Experimental spectrum (solid line) compared to the simulated one
(dashed line) in the H |
To calculate the synthetic spectra for the N(B – X),
N2(C – B), and
N2(G – W) transitions,
we used the formulas for rotational energy levels from Herzberg (1965). The set of data for molecular constants for
N(B-X)
were taken from Klynning & Pages (1982), for
N2(C-B) from Tyte & Nicholls
(1964) and for N2(G-W) from Bachmann
et al. (1993).
The number of vibrational and rotational levels is limited by the dissociation energy for a
given electronic state and in some cases by the predissociation of a molecule. This is the
case of N2(C – B) band, where
the predissociation of the C state to the
4S+2D dissociation limit precludes all bands above
v′ > 4, while B is
predissociated above v′ > 12 to the 4S + 4S
dissociation limit (Tyte & Nicholls 1964).
For the N(B – X) system, the
highest vibrational level values ever observed are v′ = 29 and
v″ = 23 for the B and X states, respectively.
The symmetry and multiplicity of electronic states are taken into account. For the
N
electronic transitions, the B and
X states are
assumed to be Hund’s case (b) (Herzberg 1965). For
the N2 molecule, the coupling type for the
B and
C states are
Hund’s case (a) for lower J values and Hund’s case (b) for higher
J values (Herzberg 1965).
In the next step, the procedure determines the relative intensity for each component. We
let n = (v′,J′) and
m = (v,J) be two molecular states. The intensity of the
transition is a product of: transition wavelength λ-1, the
Einstein coefficient proportional to λ-3, the Franck-Condon
factors (FCF) describing the vibrational excitation, the Hönl-London factors (HLF) that
describe the rotational line strength, and the distribution of populations in rotational
Pr and vibrational Pv levels:
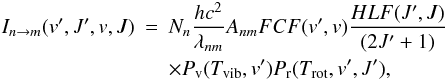 (1)where
Nn is the number of emitting molecules,
λnm the transition wavelength,
(1)where
Nn is the number of emitting molecules,
λnm the transition wavelength,
 is the Einstein
coefficient, FC(v′,v) the Franck-Condon
factor, HL(J′,J) the Hönl-London Factors
and Pvib and Prot are the
vibrational and rotational population distributions.
is the Einstein
coefficient, FC(v′,v) the Franck-Condon
factor, HL(J′,J) the Hönl-London Factors
and Pvib and Prot are the
vibrational and rotational population distributions.
For the N(B-X)
system, the FCF factors were taken from Tyte &
Nicholls (1965). The FCF for the N2(C-B) second positive system were
taken from Tyte & Nicholls (1964), and Bachmann et al. (1993) for the N2(G-W) system.
The Hönl-London factors for N(B – X) transition
were taken from Mulliken (1931). For the triplet
N2(C – B) transition,
the appropriate HLF factors were taken from Schadee
(1964) and Herzberg (1965) for the
N2(G – W) transition.
For all collision systems, the relative rotational and vibrational populations were assumed
to be given by the Boltzmann distribution described by only one parameter - the temperature,
 where
ΔEv(v′,0) is the energy difference between
the vibrational v′ and v′ = 0 levels,
ΔEJ(J′,0) is energy
difference between the rotational J′ and J′ = 0 levels,
and kB is the Boltzman constant.
where
ΔEv(v′,0) is the energy difference between
the vibrational v′ and v′ = 0 levels,
ΔEJ(J′,0) is energy
difference between the rotational J′ and J′ = 0 levels,
and kB is the Boltzman constant.
A vibrational temperature provides information on a vibrational excited species, and the
relative rates of energy exchange processes. Only at certain energies do we need to modify
vibrational populations distribution to slightly improve the quality of fitting of synthetic
spectra to experimental. In the H + N2
collision system at ELAB = 100 eV, v′ ≤ 1
vibrational levels were depopulated by a factor 0.8. For the
H + N2,
populations of v′ ≤ 2 vibrational levels were reduced by a factor of 0.6 at
ELAB = 75, 100 and 200 eV energies.
For each band a convolution of all transitions was made, calculated with the assumed Lorenzian intensity distribution function for each line. Finally, all simulated molecular bands were combined together into one spectrum, and the relative fractions of contributions were estimated.
4. Discussion
By comparing of the series of spectra presented in Fig. 1, one can notice the following features. In all collision systems, the
N(B-X)
(Δv = 0) band at 391 nm dominates in the spectra for high energies (above
ECM = 400 eV) and for energies below 25 eV. For intermediate
energies (between 50 and 400 eV), the intensity of the 391 nm band decreases, while the band
at 358 nm (composed of Δv = + 1 of
N(B-X)
and Δv = −1 of N2(C-B)) increases.
This can be explained by a significant increase in the vibrational temperature. From
Fig. 4 where we present the vibrational temperatures
of N(B) and
N2(C) as a function
of projectile velocity, we see that the physical processes present in collision of
H or
H ions
with the N2 molecule depend on projectile velocity and, in a certain velocity
range lead to very high vibrational excitation. The temperature for velocities over
250 km s-1 is about 3000 K, while for velocities near 75 km s-1, the
temperature rises to 15 000 K. In contrast, the H++N2 collision system
does not show this effect; i.e. for all projectile velocities the vibrational temperature is
constant and equal to Tvib = (3000 ± 1500) K. For all systems,
at velocities below 60 km s-1, the vibrational temperature decreases rapidly down
to (1500 ± 500) K.
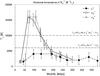 |
Fig. 4 Vibrational temperatures of the N |
The measurements of the relative band intensities of the Δv = −1
sequence of the N(B-X)
system at 427.8 nm excited by H+ and H ion
beams in a wide velocity range (from 60 up to 2180 km s-1); Moore & Doering (1969); Birely
(1974) have shown the significant shifts in vibrational distribution of
N to
higher vibrational levels for velocities below 1000 km s-1. On the other hand,
the relative band intensities of the N(B-X)
system excited by thermic ions of helium and argon in an afterglow at 400 K gas temperature
Robertson (1966) did not show any enhancement of
population distributions.
In this paper, for projectile velocities between 70–200 km s-1 (50–400 eV) for
H,
H+N2
collision systems we also observed the shifts of vibrational distribution in terms of
increment of the vibrational temperature. To check our results with the help of our computer
program, we determined the vibrational temperatures from high-resolution spectra of the
N first
negative system Δv = −1 sequence (see Fig. 1 in Moore & Doering 1969) excited by 0.3 keV, 1 keV, 3 keV and
10 keV- H ions,
the obtained values are 12 000 K, 3000 K, 2000 K, and 1500 K, respectively, with about 20%
relative uncertainty. These values agree with results obtained in our experiment.
The relative band intensities (the product of relative population and FC factors, Moore & Doering 1969; Birely 1974) or the vibrational temperatures determined in this paper are
based on using the Franck-Condon factors determined for electronic transitions of isolated
N2 and N
molecules. But for the ion-molecule collision complex, this factor could be different and
depend on the velocity of the perturbing ion.
From results of the relative band intensitie measurements or vibrational temperature, we
see that, for very low velocities (bellow 50 km s-1) and for very high velocities
(>1000 km s-1), the Franck-Condon model (assuming vertical ionization
of N2(X ,
v = 0) to N)
satisfactory describes the observed spectra and that the vibrational temperature of the
N
molecule droops to same given value (for instance <1500 K for
H+N2).
However, for velocities 50–1000 km s-1 the Franck-Condon model is inadequate.
,
v = 0) to N)
satisfactory describes the observed spectra and that the vibrational temperature of the
N
molecule droops to same given value (for instance <1500 K for
H+N2).
However, for velocities 50–1000 km s-1 the Franck-Condon model is inadequate.
However, the H++N2 system differs, since we did not observe a very enormous increase in the vibrational temperature. This contradicts some conclusions from the intensity ratio measurements of Moore & Doering (1969) that “The vibrational excitation was found to be solely dependent on the projectile ion’s laboratory velocity and independent of its chemical identity”. It appears that vibrational distribution depends on type of projectile.
Another feature is the increased intensity of the N2(C-B) bands
(Δv = + 2 at 297 nm, Δv = + 1 at 316 nm and
Δv = 0 at 337 nm) in the H+N2
and H + N2
collision systems. Once again these two cases differ from the H++N2
system, where the abundance of N2(C-B) is clearly smaller. Also the
N/N2
ratio changes with the projectile energy.
Furthermore, at energies in the 50–400 eV range a quasi-continuum appears in the 300–400 nm
range. This feature was observed earlier for the Ne+ (Brandt et al. 1973), He+ (Simonis 1977) and Ar2+ (Neuschäfer
et al. 1979) impact on N2 at low energies. At first, this feature was
tentatively assigned to the N(B-X)
tail bands (emission from high vibrational levels of
N(B));
(Neuschäfer et al. 1979). However, high-resolution
spectra presented in Fig. 5 do not support this. Here
only v′ < 3 band heads are visible. Later Simonis (1977) proposed that the charge transfer populates some
high-lying electronic states of N, from
there cascading transitions to the ground state occur, emitting the quasi-continuum.
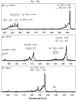 |
Fig. 5 Experimental spectra (solid line) compared to the simulated ones (dashed line) for
the H |
In our studies we propose another explanation. This quasi-continuum feature is an
N2(G – W) band system
discovered and investigated in Bachmann et al. (1993).
From computer simulations of this band presented in Fig. 3d we can see the quasi-continuum shape of this transition. Additionally the very
good agreement between experimental and computer-generated spectra (see Fig. 1) confirms our assumption. Another argument for this is
that we have observed another electronically excited state of N2.
While the vibrational temperature for N(B) varies
significantly with collision energy, it is constant at all energies for the N2
states. For the H++N2 system
Tvib = (6000 ± 2000) K and for the
H,
H + N2
systems, Tvib = (10 000 ± 2000) K.
The products formed in all investigated collision systems were found to be in a non equilibrium state, and the rotational temperature appears to be independent of processes leading to enormous vibrational excitation. From high resolution spectra collected for all collision systems and at several energies (examples are presented in Fig. 5), we have estimated the rotational temperatures Trot for the analyzed bands for which the simulated contour fits the experimental one satisfactorily. From these studies, we found that, for the 50–1000 eV energy range and for all collision systems, the rotational temperature is constant and is roughly equal to the gas kinetic temperature Trot = (500 ± 300) K and slightly decreases to (200 ± 100) K for energies below 50 eV.
The total relative emission cross sections for the investigated collision systems are
presented in Fig. 2. The experimental uncertainties are
mean standard deviations from 3 up to 14 independent measurements at given energy. For the
H+, H + N2
collision systems, the cross section increases almost three times through the 50–1000 eV
energy range. In contrast, the cross section for the
H + N2
collision system is higher than H+, H + N2
systems, and practically does not change through the entire investigated energy range.
With the help of computer simulations we were able to determine the relative abundances of
different molecular bands in overall spectra for each energy. Van Zyl et al. (1983) measured N
(Δv = −1 at 427.8 nm) absolute emission cross sections for
H+ impacting on N2 in the 63–2000 eV energy range. These values can
be used to calibrate our relative cross sections. The
N
(Δv = −1 at 427.8 nm) band makes about 19% of all
N(B-X)
spectra, thus the absolute cross section for N(B)
excitation from Van Zyl et al. (1983) was divided by
0.19. In this way, we found the multiplier converting our relative cross sections into the
absolute values. The calibrated absolute cross sections of the identified products for the
H+ + N2, H + N2,
and H + N2
collision systems are presented in Fig. 6a–c. Here the
energy – dependent luminescence cross section of N(B-X)
and sum of two observed N2 bands are plotted together with the absolute cross
sections for H+ + N2 collision system of Van Zyl et al. (1983).
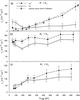 |
Fig. 6 Normalized absolute emission cross sections of identified products for a)
H+ + N2, b)
H |
Gao et al. (1990) report the measurements of
differential and integral absolute cross sections for charge transfer in collisions of
H+ and He+ with several molecules, including the N2
at 0.5, 1.5, and 5.0 keV energies. Van Zyl et al.
(1983) determined total emission cross section of the
N
427.8 nm band induced by the H+ impact on N2 at 500 eV energy and
obtained a value of about 9.34 × 10⁻¹⁸ cm2. This band, at
vibrational temperatures determined in this paper, makes about 19% of all
N(B-X)
spectra. Using the total cross sections for electron capture at 500 eV
(2.5 × 10⁻¹⁶ cm2) obtained by Gao et al. (1990), we can estimate
thet the percentage of the total charge transfer reactions leading to the electronically
excited state product is about 20%. Extrapolating Gao et al.
(1990) values to 1000 eV and using the Van Zyl
et al. (1983) emission cross section, we see that about 30% of collisions lead to
excited products.
Combining the total cross sections for electron capture at 2000 eV
(5.03 × 10⁻¹⁶ cm2) measured in Hasan (2005) and the emission cross section of the
N
427.8 nm band induced by the H impact
on N2 at 2000 eV energy (7 × 10-18 cm2) determined in
Lee & Suen (1998), the percentage of the
total charge transfer reactions leading to the electronically excited state product is
about 7%. Extrapolating results from Lee & Suen
(1998) to 1000 eV and Hasan (2005) gives 4%.
But these percentages strongly disagree with the values obtained where taking the emission
cross sections for H + N2
determined in present paper. For instance, using values of Hasan (2005) and the present result at 1000 eV energy, we obtain 65% of the
collisions leading to excited products (two times higher than at the same energy in
H+ + N2 collision), while it was only 4% for
σe determined in Lee &
Suen (1998). This discrepancy is a consequence of using by Lee & Suen (1998) values of (Sheridan & Clark 1965) for calibration, were procedures for absolute
calibration of the photon detector used were not highly accurate Van Zyl et al. (1983). For calibration in our studies we have used most
recent values of Van Zyl et al. (1983), measured with
the TIF technique. An accurate procedure for obtaining absolute values for cross sections
used by them involves calibration based on several independent measurements of emission
cross sections in collisions of 500 eV– e− with He, Ar, Kr, and N2.
Frequently, in the determinations of N
abundance (for instance for N/CO+
ratio in comets, Cochran 2002), the (0, 0) band of
N(B-X)
at 391.4 nm is used. From computer simulations it shows that the
N(B-X)
abundance determined only from emission of 391.4 nm band could be distorted by excitation
conditions leading to variations in vibrational temperatures. The
Δv = 0 band at 391.4 nm makes 70% of all spectra for low temperature
(1000 K) and decreases by a factor of 3.5 down to 20% for high temperatures (15 000 K).
Furthermore, if the excitation occurs in the collisions of hydrogen ions with the
N2 molecule (comets, molecular clouds interacting with stellar wind), for
determining the abundance of the N2 molecule from emission spectra, it is also
important to also take the presence of N2 emission into account, along with the
emission from charge transfer N
products. We found that, in the 10–1000 eV energy range, the
N/N2
ratios for H+, H, and
H
+N2 are in the range of (0.4–3.8), (0.9–1.2), and (0.6–1.5), respectively. Once
again, in the case of H and
H ions,
these ratios are similar, and the N2/N
fraction is almost 1:1, while for H+ + N2 at higher energies,
N
dominates.
5. Conclusions
Spectroscopic studies of collisions between H+,
H,
H ions
and nitrogen molecule under controlled conditions in the laboratory give unique opportunity
for testing the interaction of ion flux (for instance stellar wind) with interstellar
molecular clouds. In our studies we can give the possible processes taking place in the
investigated collision systems: ![Mathematical equation: \begin{eqnarray} {\rm H}_n^++N_2 &\rightarrow & {\rm N}_2^{+}+[{\rm H}]_n \\ &\rightarrow & {\rm N}_2^{+}+{\rm e}^-+[{\rm H}]_n^+ \\ &\rightarrow & {\rm N}_2+[{\rm H}]_n^+ \\ &\rightarrow & {\rm H}{\rm N}_2^++[{\rm H}]_{n-1}^+, \end{eqnarray}](/articles/aa/full_html/2011/11/aa17115-11/aa17115-11-eq88.png) where
n = 1, 2, 3 and
where
n = 1, 2, 3 and ![Mathematical equation: \hbox{$[{\rm H}]_n^+$}](/articles/aa/full_html/2011/11/aa17115-11/aa17115-11-eq90.png) stand for the
unknown state of the remaining products in the process.
stand for the
unknown state of the remaining products in the process.
The charge transfer process of the type (4) and direct impact ionization (5) of the target
molecule will result in the formation of N either
in ground or excited states. Unfortunately, both processes cannot be distinguished in our
experiment. However, in the energy range presented in this paper the ionization proces (5)
is of minor importance. If we compare the total cross section for ionization (proces 5)
measured by De Heer & Aarts (1970) and for
charge transfer (proces 4) obtained by Hoffman et al.
(1981) for the H+ + N2 system at 10 keV, we notice that about
5% of events will lead to ionization, while about 80% will result in ionization at 100 keV
energy. Because the ionization cross section decreases for low energies, while the charge
transfer cross section increases, thus for a lower projectile energies the charge transfer
process will dominate.
Process of type (6) is the direct impact excitation of target molecule leading to N2 excitation.
The fourth possible process is the formation of protonated nitrogen
HN, i.e.
reaction path (7). The formation of HN is
efficient at low energies (<10 eV) and is unlikely at the higher energies used in
present paper. Schultz & Armentrout (1992)
measured the cross sections for formation of HN in
reactions of N with
H2, D2 and HD at 0.1 up to 80 eV energies in the laboratory system.
In the 0.1–80 eV energy range, the cross section for forming
HN
decreases rapidly more than two orders of magnitude, reaching a value below
10-16 cm2 for 80 eV energy and at still higher energies, it falls
off even faster. Furthermore, at the lowest energies the charge transfer cross section is
two orders of magnitude smaller than for HN and
shows little energy dependency. This means that at a given energy (above 20 eV in a center
of mass) the charge transfer will dominate. Of course, this collision system differs from
ours by changing the projectile ion with the target molecule, but Schultz & Armentrout (1992) have also shown that at very low
energies the collision cross sections can be described well with the Langevin- Giomousis-
Stevenson model, where for reactions of N + D2
and D + N2,
the cross section are the same order of magnitude and the same applies for the
N + H2
and H + N2
cross section because the neutral polarizability of H2 and D2 is
similar.
We have not found any evidence for electronically excited NH or NH+ radicals, in
the investigated spectral range, i.e. no trace of the NH(A3Π – X3Σ)
band at 336 nm or the NH+(B2Δ – X2Π) band at 435 nm. The
lack of the NH chemiluminescence signal can be explained by comparing it with other
investigations of hydrogen-nitrogen collision systems. The electron impact dissociation of
N2, according to the equation
 (8)will
result in ionized and neutral nitrogen atoms in the ground or metastable electronic states.
(8)will
result in ionized and neutral nitrogen atoms in the ground or metastable electronic states.
The following reactions, including slow nitrogen and hydrogen atoms, leading to
electronically excited NH and NH+ were investigated:
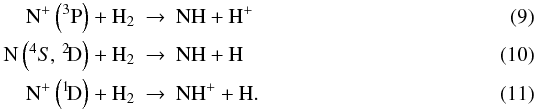 Reaction
(9) between N+ in the ground 3P state and H2 were reported
in Kusunoki & Ottinger (1979). Reactions (10)
for the ground N(4S) and metastable N(2D) states with H2,
were presented in Ottinger et al. (1999) and Kowalski et al. (2004b), respectively. Kusunoki & Ottinger (1984) studied the excited
NH+ produced in the reaction (11) of the N+ ion in the metastable
1D state. In these studies, the NH luminescence cross sections for
reactions (9) and (10) exhibit the threshold behavior above approximately 4 eV, the peak
maxima at energy between 8 and 15 eV due to an insertion-type reaction, and a rapid decrease
in the cross section for higher energies, probably due to a two-body impulsive mechanism. In
reaction (11), the maxima of NH+ emission cross section is about 1.5 eV,
decreasing thereafter monotonically with increasing energy (Kusunoki & Ottinger 1984). Thus, the NH or NH+ signal is only
observed in this narrow energy range.
Reaction
(9) between N+ in the ground 3P state and H2 were reported
in Kusunoki & Ottinger (1979). Reactions (10)
for the ground N(4S) and metastable N(2D) states with H2,
were presented in Ottinger et al. (1999) and Kowalski et al. (2004b), respectively. Kusunoki & Ottinger (1984) studied the excited
NH+ produced in the reaction (11) of the N+ ion in the metastable
1D state. In these studies, the NH luminescence cross sections for
reactions (9) and (10) exhibit the threshold behavior above approximately 4 eV, the peak
maxima at energy between 8 and 15 eV due to an insertion-type reaction, and a rapid decrease
in the cross section for higher energies, probably due to a two-body impulsive mechanism. In
reaction (11), the maxima of NH+ emission cross section is about 1.5 eV,
decreasing thereafter monotonically with increasing energy (Kusunoki & Ottinger 1984). Thus, the NH or NH+ signal is only
observed in this narrow energy range.
This leads to the conclusion that the (10–1000 eV) H+ and
H
hydrogen ions present in the stellar wind, as well as
H
encountering the N2 molecule, cannot be the direct source of interstellar
nitrogen monohydride NH. Instead, the N ions
produced in a charge transfer (reaction 4) or fragments arising from the electron impact
dissociation (reaction 8) of N2 impacting at the thermal energies of
H2 (reactions 9–11) or of other molecules could be the source of the observed
NH or other polyatomic molecules (like HN
according with the reaction N+H2 → HN+H,
Adams & Smith 1981).
It has been shown that electron excitation can be satisfactory described by a model of
vertical ionization (Franck-Condon principle) for
N2(X,
v = 0) to N at
electron energies greater than 100 eV. For H and
H
collision systems, the enormous increase in the vibrational temperature (see Fig. 4) indicates that at certain energies the transition is of
non-Franck-Condon type. Beyond this range the reaction is well described by vertical
transition model.
While the projectile ion approaches the target molecule, the electron cloud of the target molecule will be deformed by ion field before the moment when one electron from molecule is captured. This probably will result in a change in the internuclear distance of the molecule and perturbation of the vibrational wave functions. For very slow projectile velocities, the ion will not approach the molecule close enough before electron capture, so the deformation will be negligible. At very high velocities, the ion will immediately reach the distance where electron capture is inevitable, while the internuclear distance will not manage to change significantly in a very short period of time. Thus, at very low and very high velocities the distortion of vibrational populations (thus the increase in vibrational temperature) is minor.
Forsén & Roos (1970) investigated the
consequence of adding a proton to the closed-shell N2 molecule and found that
this will have a negligible effect on N2 internuclear distance (about 0.1%)
leading to the weak vibrational excitation of the nitrogen molecule. This would explain why
the H+ + N2 has a vibrational temperature lower than for two other
ions. The H and
H ions
probably have a stronger influence on the electron cloud, causing the change in internuclear
distance between N2 nuclei.
The dependency of vibrational temperatures on projectile velocity could be used to infer
the energies of projectiles producing the emission of
N, for
example, in comets or aurora. Another conclusion is that in the collision systems
investigated, the excitation conditions affect the N emission spectra as observed, for instance, in the comets or molecular clouds, thus could be
the source of uncertainties in spectroscopically determined ratios of molecular nitrogen
relative to various gases.
emission spectra as observed, for instance, in the comets or molecular clouds, thus could be
the source of uncertainties in spectroscopically determined ratios of molecular nitrogen
relative to various gases.
References
- Adams, N. G., & Smith, D. 1981, ApJ, 247, L123 [NASA ADS] [CrossRef] [Google Scholar]
- Arnett, D. 1996, Supernovae and Nucleosynthesis (Princeton, New Jersey: Princeton University Press) [Google Scholar]
- Böhm-Vitense, E. 1989, Introduction to Stellar Astrophysics, vol. 2: Stellar Atmospheres (Cambridge University Press) [Google Scholar]
- Bachmann, R., Ottinger, Ch., & Vilesov, A. F. 1993, J. Chem. Phys., 99, 3262 [NASA ADS] [CrossRef] [Google Scholar]
- Bearman, G. H., Earl, J. D., Pieper, R. J., Harris, H. H., & Leventhal, J. J. 1976, Phys. Rev. A, 13, 1734 [NASA ADS] [CrossRef] [Google Scholar]
- Birely, J. H. 1974, Phys. Rev. A, 10, 550 [NASA ADS] [CrossRef] [Google Scholar]
- Brandt, D., Ottinger, Ch., & Simonis, S. 1973, Ber. Bunsenges. Phys. Chem., 77, 648 [Google Scholar]
- Browning, R., & Gilbody, H. B. 1968, J. Phys. E: At. Mol. Phys., 1, 1149 [NASA ADS] [CrossRef] [Google Scholar]
- Churyumov, K. I., & Chorny, G. F. 1992, in Lunar and Planetary Inst., Asteroids, Comets, Meteors, 117 [Google Scholar]
- Cochran, A. L. 2002, ApJ, 576, L165 [NASA ADS] [CrossRef] [Google Scholar]
- Cochran, A. L., Cochran, D., & Barker, E. S. 2000, Icarus, 146, 583 [Google Scholar]
- Croswell, K. 2000, Alchemy of the Heavens (Oxford Univ Pr. (Sd)) [Google Scholar]
- DeHeer, F. J., & Aarts, J. F. M. 1970, Physica (Utrecht), 48, 620 [NASA ADS] [CrossRef] [Google Scholar]
- Forsén, S., & Roos, B. 1970, Chem. Phys. Lett., 6, 128 [NASA ADS] [CrossRef] [Google Scholar]
- Gao, R. S., Johnson, L. K., Hakes, C. L., Smith, K. A., & Stebbings, R. F. 1990, Phys. Rev. A, 41, 5929 [NASA ADS] [CrossRef] [PubMed] [Google Scholar]
- Geiss, J., Gloeckler, G., & Von Steiger, R. 1994, Phil. Trans. R. Soc. Lond. A, 349, 213 [Google Scholar]
- Gruntman, M. 1996, J. Geophys. Res., 101(A7), 15555 [NASA ADS] [CrossRef] [Google Scholar]
- Hasan, A. T. 2005, Int. J. Mass Spectrom., 247, 81 [NASA ADS] [CrossRef] [Google Scholar]
- Herbst, E., & Klemperer, W. 1973, ApJ, 185 [Google Scholar]
- Herzberg, G. 1965, Molecular Spectra and Molecular Structure, vol. I, Spectra of Diatomic Molecules (New York: Van Nostrand – Reinhold) [Google Scholar]
- Hoffman, J. M., Lockwood, G. J., & Miller, G. H. 1981, Phys. Rev. A, 23, 2983 [NASA ADS] [CrossRef] [Google Scholar]
- Klynning, L., & Pages, P. 1982, Phys. Scr., 25, 543 [NASA ADS] [CrossRef] [Google Scholar]
- Knauth, D. C., Andersson, B.-G., McCandliss, S. R., & Moos, H. W. 2004, Nature, 429, 636 [NASA ADS] [CrossRef] [Google Scholar]
- Kowalski, A., Pranszke, B., & Ottinger, Ch. 2004a, Chem. Phys. Lett. 383, 156 [NASA ADS] [CrossRef] [Google Scholar]
- Kowalski, A., Pranszke, B., Werbowy, S., & Ottinger, C. 2004b, Chem. Phys. Lett., 389, 218 [NASA ADS] [CrossRef] [Google Scholar]
- Kusunoki, I., & Ottinger, C. 1979, J. Chem. Phys., 70, 699 [NASA ADS] [CrossRef] [Google Scholar]
- Kusunoki, I., & Ottinger, C. 1984, J. Chem. Phys., 80, 1872 [NASA ADS] [CrossRef] [Google Scholar]
- Lamers, H. J. G. L. M., & Cassinelli, J. P. 1999, Introduction to Stellar Winds (Cambridge University Press) [Google Scholar]
- Lee, C. S., & Lin, C. H. 2002, Phys. Rev. A, 65, 042712 [NASA ADS] [CrossRef] [Google Scholar]
- Lee, C. S., & Suen, J. T. 1998, Nucl. Instr. Meth. Phys. Res. B, 140, 273 [NASA ADS] [CrossRef] [Google Scholar]
- Luna, H., Michael, M., Shah, M. B., et al. 2003, J. Geophys. Res., 108, 5033 [Google Scholar]
- McCall, B. J., Geballe, T. R., Hinkel, K. H., & Oka, T. 1998, Science, 279, 1910 [NASA ADS] [CrossRef] [PubMed] [Google Scholar]
- Moore, J. M., & Doering, J. P. 1969, Phys. Rev., 177, 218 [NASA ADS] [CrossRef] [Google Scholar]
- Mulliken, R. S. 1931, Rev. Mod. Phys., 3, 89 [NASA ADS] [CrossRef] [Google Scholar]
- Nassar, H., Pellerin, S., Musiol, K., et al. 2004, J. Phys. D: Appl. Phys., 37, 1904 [NASA ADS] [CrossRef] [Google Scholar]
- Neuschäfer, D., Ottinger, Ch., Zimmermann, S., et al. 1979, Int. J. Mass. Spect. Ion Phys., 31, 345 [CrossRef] [Google Scholar]
- Ottinger, Ch., & Simonis, J. 1978, Chem. Phys., 28, 97 [NASA ADS] [CrossRef] [Google Scholar]
- Ottinger, C., Brozis, M., & Kowalski, A. 1999, Chem. Phys. Lett., 315, 355 [NASA ADS] [CrossRef] [Google Scholar]
- Persson, C. M., Black, J. H., Cernicharo, J., et al. 2010, A&A, 521, L45 [NASA ADS] [CrossRef] [EDP Sciences] [Google Scholar]
- Pranszke, B., Werbowy, S., & Lawicki, A. 2011, Phys. Rev. A, 83, 032707 [NASA ADS] [CrossRef] [Google Scholar]
- Robertson, W. W. 1966, J. Chem. Phys., 44, 2456 [NASA ADS] [CrossRef] [Google Scholar]
- Sandford, S. A., & Allamandola, L. J. 1993, ApJ, 417, 815 [NASA ADS] [CrossRef] [PubMed] [Google Scholar]
- Sanford, S. A., Bernstein, L. J., Allamandola, L. J., Goorvitch, D., & Teixeira, T. C. V. S. 2001, ApJ, 548, 836 [NASA ADS] [CrossRef] [Google Scholar]
- Schadee, A. 1964, Bull. Astron. Inst. Ned., 17, 311 [Google Scholar]
- Schultz, R. H., & Armentrout, P. B. 1992, J. Chem. Phys., 96, 1036 [NASA ADS] [CrossRef] [Google Scholar]
- Sheridan, J. R., & Clark, K. C. 1965, Phys. Rev., 140, 1033 [NASA ADS] [CrossRef] [Google Scholar]
- Abe, S., Ebizuka, N., Yano, H., Watanabe, J. I., & Borovička, J. 2005, ApJ, 618, L141 [NASA ADS] [CrossRef] [Google Scholar]
- Simonis, S. 1976, Ph.D. Thesis, University of Bonn, Max-Planck-Institut für Strömungsforschung, Göttingen, Berich 3/1977 [Google Scholar]
-
Tyte, D. C., & Nicholls, R. W. 1964, Identification Atlas of Molecular Spectra: No. 2, The N
 B
B  – X
– X  Second Positive System, The University of Western Ontario, London, Ontario
[Google Scholar]
Second Positive System, The University of Western Ontario, London, Ontario
[Google Scholar]
-
Tyte, D. C., & Nicholls, R. W. 1965, Identification Atlas of Molecular Spectra: No. 3, The N B – X First Negative System of Nitrogen, The University of Western Ontario, London, Ontario
[Google Scholar]
- Van Zyl, B., Gealy, M. W., & Neumann, H. 1983, Phys. Rev. A, 28, 2141 [NASA ADS] [CrossRef] [Google Scholar]
- Wyckoff, S., & Theobald, J. 1989, Adv. Space Res., 9, 157 [NASA ADS] [CrossRef] [PubMed] [Google Scholar]
- Yousif, F. B., Geddes, J., & Gilbody, H. B. 1986, J. Phys. B, 19, 217 [NASA ADS] [CrossRef] [Google Scholar]
All Figures
|
Fig. 1 Selected luminescence spectra for the H+ + N2,
H |
| In the text | |
|
Fig. 2 Excitation functions for H+ + N2,
H |
| In the text | |
|
Fig. 3 a) Experimental spectrum (solid line) compared to the simulated one
(dashed line) in the H |
| In the text | |
|
Fig. 4 Vibrational temperatures of the N |
| In the text | |
|
Fig. 5 Experimental spectra (solid line) compared to the simulated ones (dashed line) for
the H |
| In the text | |
|
Fig. 6 Normalized absolute emission cross sections of identified products for a)
H+ + N2, b)
H |
| In the text | |
Current usage metrics show cumulative count of Article Views (full-text article views including HTML views, PDF and ePub downloads, according to the available data) and Abstracts Views on Vision4Press platform.
Data correspond to usage on the plateform after 2015. The current usage metrics is available 48-96 hours after online publication and is updated daily on week days.
Initial download of the metrics may take a while.