Fig. 1
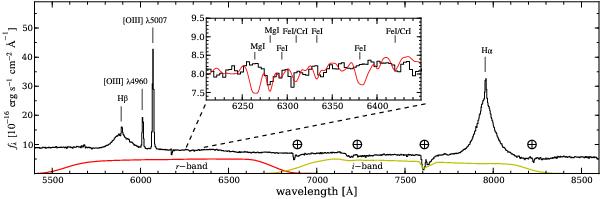
Integrated QSO spectrum of HE 2158−0107 as observed with the PMAS integral field spectrograph. All prominent emission lines are labelled and the four telluric absorption bands in the red part of the spectrum are marked. The red and yellow curves below the QSO spectrum represent the arbitrarily scaled r- and i-band transmission curves, respectively. The inset highlights the wavelength region of potentially strong stellar absorption lines. The redshifted spectrum of a 5 Gyr old SSP with solar metallicity (Bruzual & Charlot 2003) is overplotted as the red line in the inset for direct comparison and the main chemical species leading to the various absorption lines are labelled.
Current usage metrics show cumulative count of Article Views (full-text article views including HTML views, PDF and ePub downloads, according to the available data) and Abstracts Views on Vision4Press platform.
Data correspond to usage on the plateform after 2015. The current usage metrics is available 48-96 hours after online publication and is updated daily on week days.
Initial download of the metrics may take a while.