| Issue |
A&A
Volume 535, November 2011
|
|
|---|---|---|
| Article Number | A72 | |
| Number of page(s) | 14 | |
| Section | Extragalactic astronomy | |
| DOI | https://doi.org/10.1051/0004-6361/201117596 | |
| Published online | 11 November 2011 | |
The low-metallicity QSO HE 2158 − 0107: a massive galaxy growing by accretion of nearly pristine gas from its environment?⋆
1
Leibniz-Institut für Astrophysik Potsdam (AIP), An der Sternwarte 16, 14482 Potsdam, Germany
e-mail: This email address is being protected from spambots. You need JavaScript enabled to view it.
2
Max-Planck-Institut für Astronomie, Königsstuhl 17, 69117 Heidelberg, Germany
3
Centro Astronómico Hispano Alemán de Calar Alto (CSIC-MPIA), 4004 Almería, Spain
Received: 29 June 2011
Accepted: 14 September 2011
Abstract
The metallicities of active galactic nuclei (AGN) are usually well above solar in their narrow-line regions, often reaching up to several times solar in their broad-line regions independent of redshift. Low-metallicity AGN are rare objects that have so far always been associated with low-mass galaxies hosting low-mass black holes (MBH106M⊙). We present integral field spectroscopy data of the low-redshift (z = 0.212) quasi-stellar object (QSO) HE 2158 − 0107 for which we find strong evidence of sub-solar NLR metallicities associated with a massive black hole (MBH ~ 3 × 10⁸M⊙). The QSO is surrounded by a large extended emission-line region reaching out to 30 kpc from the QSO in a tail-like geometry. We present optical and near-infrared images and investigate the properties of the host galaxy. The host of HE 2158 − 0107 is most likely a very compact bulge-dominated galaxy with a size of re ~ 1.4 kpc. The multi-colour spectral energy distribution (SED) of the host is quite blue, indicative of a significant young age stellar population formed within the last 1 Gyr. A 3σ upper limit of Lbulge,H < 4.5 × 10¹⁰L ⊙ ,H for the H-band luminosity and a corresponding stellar mass upper limit of Mbulge < 3.4 × 10¹⁰M⊙ show that the host is offset from the local black hole-bulge relations. This is independently supported by the kinematics of the gas. Although the stellar mass of the host galaxy is lower than expected, it cannot explain the exceptionally low metallicity of the gas. We suggest that the extended emission-line region and the galaxy growth are caused by the infall of nearly pristine gas from the environment of the QSO host. Minor mergers of low-metallicity dwarf galaxies or the theoretically predicted smooth accretion of cold (~ 104 K) gas are both potential drivers behind that process. Because the metallicity of the gas in the QSO narrow-line region is much lower than expected, we suspect that the external gas has already reached the galaxy centre and may even contribute to the current feeding of the black hole. HE 2158 − 0107 appears to represent a particular phase of substantial black hole and galaxy growth that can be observationally linked with the accretion of external material from its environment.
Key words: galaxies: active / galaxies: ISM / quasars: emission lines / quasars: individual: HE 2158 − 0107
Based on observations collected at the Centro Astronómico Hispano Alemán (CAHA) at Calar Alto, operated jointly by the Max-Planck-Institut für Astronomie and the Instituto de Astrofísica de Andalucía (CSIC) and on observations collected at the European Organisation for Astronomical Reasearch in the Southern Hemisphere, Chile (program 070.B-0418).
© ESO, 2011
1. Introduction
Active galactic nuclei (AGN) are thought to be powered by the accretion of ambient gas onto a supermassive black hole (BH) in the centre of their host galaxies. Because AGN can reach high luminosities for the most massive BHs (MBH ~ 1010M⊙), they can be observed as quasi-stellar objects (QSOs) up to redshifts beyond z > 6 (Fan et al. 2003; Mortlock et al. 2011). The emission lines in the broad line regions (BLR) and the narrow line regions (NLR) of AGN can be used to infer gas metallicities (e.g. Hamann & Ferland 1993). The QSOs are therefore considered as an important diagnostic for the metal enrichment and evolution of galaxies across cosmic time (e.g. Matteucci & Padovani 1993; Hamann & Ferland 1993, 1999). The metallicities in the BLR were found to be supersolar, reaching 10Z⊙ in some cases, and to be correlated with the AGN luminosity, accretion rate, and BH mass (e.g. Hamann & Ferland 1993; Shemmer et al. 2004; Warner et al. 2004; Nagao et al. 2006; Matsuoka et al. 2011), with almost no redshift evolution. This is usually interpreted in terms of vigorous star-formation building up the massive galaxies in which BHs reside and grow.
Because the BLR is confined to the very circumnuclear region on scales of 1 pc (e.g. Kaspi et al. 2000), it is not yet clear how the BLR metallicities are linked to the evolution of their host galaxies. The NLR, on the other hand, is spatially extended on kpc scales (e.g. Bennert et al. 2002; Schmitt et al. 2003; Bennert et al. 2006a,b; Husemann et al. 2008) and is certainly more representative of the host galaxy properties. Emission-line ratios in nearby AGN are readily observable and their values have been calibrated to metal abundances via photoionisation models (e.g. Storchi-Bergmann et al. 1998; Groves et al. 2004). Systematic studies of obscured AGN by Groves et al. (2006) and Barth et al. (2008), based on spectroscopic data of the Sloan Digital Sky Survey (SDSS, York et al. 2000), revealed that AGN with NLR metallicities around solar and below with respect to the solar abundance set of Asplund et al. (2005) are extremely rare and only found in low-mass galaxies hosting BHs with MBH106M⊙. Because only a few percent of all luminous AGN are found in host galaxies with stellar masses less than 1010M⊙ (e.g. Kauffmann et al. 2003), the BH mass-bulge mass relation Häring & Rix (2004) combined with the mass-metallicity relation of galaxies (e.g. Tremonti et al. 2004) therefore naturally explains the rareness of low-metallicity AGN.
The QSO HE 2158 − 0107 at z = 0.212 was discovered by the Hamburg-ESO survey (HES, Wisotzki et al. 2000). A radio flux of 1.6 mJy at 1.4 GHz was measured for this QSO by the FIRST survey (Becker et al. 1995). Because of its optical brightness (B = 16.7) the object is classified as a radio-quiet QSO. The SDSS targeted this QSO because of its X-ray and radio properties as well and catalogued it as SDSS J220103.13-005300.2. It is also listed in the QSO catalogue of Véron-Cetty & Véron (2010), but not in the catalogue of Schneider et al. (2010). The public SDSS spectrum of this particular QSO is of very poor quality. In this paper we present evidence that HE 2158 − 0107 is an unusually low-metallicity QSO for its high BH mass, with a likewise unusually low-mass host galaxy. We combine our own integral field spectrophotometry with archival optical and infrared photometry to explore the properties of this particular QSO in more detail.
Throughout this paper we assume a cosmological model with H0 = 70kms-1Mpc-1, Ωm = 0.3, and ΩΛ = 0.7. The adopted cosmology corresponds to a physical scale of 3.45kpcarcsec-1 at the redshift of HE 2158 − 0107 (z = 0.212). We will always use the AB system (Oke 1974) throughout the paper or explicitly refer to Vega magnitudes if required for the sake of comparison.
2. Observations and data reduction
2.1. Integral field spectroscopy
We observed HE 2158 − 0107 with the Potsdam Multi-Aperture Spectro-Photometer (PMAS, Roth et al. 2005) mounted on the 3.5 m telescope of the Calar Alto Observatory in the night of 2002 September 6, as part of a larger sample of radio-quiet QSOs (Husemann et al. 2008, in prep.). Two exposures of 1800 s each were obtained under photometric conditions at a seeing of .
In the lens array configuration of PMAS we covered an 8 × 8 field of view centred on the QSO. Two-hundred-fifty-six individual spectra were obtained at a spatial sampling of . The low-resolution V300 grism was positioned such that the Hβ and Hα emission lines could be covered in a single exposure. We determined a spectral resolution for this instrumental setup of R ~ 900 from a O i λ5577 night sky line width of 6.1 Å FWHM.
We reduced the integral field data with the R3D package (Sánchez 2006). Here we just briefly summarise the process because the details will be described in Husemann et al. (in prep.), where the entire dataset will be presented. We used the continuum and arc lamp calibration frames taken specifically for the target at the same time and airmass to trace and extract the 256 spectra on the CCD and to perform an absolute wavelength calibration. Twilight observations were obtained to construct a fibre flat-field to correct for the difference in fibre-to-fibre transmission. Photometric standard star observations allowed an absolute photometric calibration of the data including the correction for the atmospheric extinction at the Calar Alto site (Sánchez et al. 2007). A high S/N sky spectrum was extracted from a blank sky area within the PMAS field of view, which we subsequently subtracted from the entire datacube. After correcting for differential atmospheric refraction, we spatially aligned the two exposures and co-added both to obtain the final datacube.
2.2. Near-infrared and optical ground-based imaging
An H-band image of HE 2158 − 0107 was acquired with the SOFI IR spectrograph and imaging camera (Moorwood et al. 1998) mounted on the New Technology Telescope of the La Silla Observatory. Ten exposures were taken in the large-field camera mode (029 pixel-1) consisting of 12 sub-integrations (NDIT) with exposure times of 5 s (DIT) each, yielding a total integration time of 600 s on the source. The seeing during the observation was 08. We reduced these images with standard calibration frames using the public SOFI reduction pipeline provided by ESO. We measured an H-band magnitude of 14.67 mag (Vega) for the QSO, which is quite close to the value of 14.70 mag (Vega) reported by UKIDSS (Warren et al. 2007) and indicates a good photometric calibration of the image.
Fortunately, HE 2158 − 0107 is in the footprint of the Supernova Survey as part of SDSS (Adelman-McCarthy et al. 2008, for DR7), which covered 270 deg (a 2.5 wide scan along the celestial equator, generally called “Stripe 82”) that were observed ~80 times during September, October, and November of the years 1998–2007. We stacked the multiple epoch exposures to reach significantly deeper. This method was already applied to Stripe 82 data for precise photometry of galaxies (Gilbank et al. 2010) and to study details in the structure of nearby galaxies (Schawinski et al. 2010). Because the observations of Stripe 82 were made under varying ambient conditions, we co-added only the best 24 epochs with a seeing of < 13 and a limiting sky surface brightness of >20 mag arcsec-2 in the r-band. The combined images effectively reach ~5 times deeper (~2 mag) compared to the individual SDSS images. Table 1 summarises the effective seeing and limiting surface brightness for the combined images as well as the Galactic extinction inferred from the Schlegel et al. (1998) extinction maps.
Properties of the SDSS Stripe 82 images.
3. Black hole mass and NLR metallicity
3.1. QSO spectrum of HE 2158 − 0107
We first obtained the nuclear spectrum of HE 2158−0107 from the PMAS observation using a collapsed image of the datacube as a spatial weighting profile for the extraction. The resulting QSO spectrum with a S/N of about 100 per pixel in the continuum is shown in Fig. 1. Prominent broad Hβ and Hα emission lines are visible as well as narrow emission lines from the NLR. From the narrow [O iii] λ5007 line ([O iii] hereafter) in the QSO spectrum we measured a redshift of z = 0.2118.
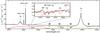 |
Fig. 1 Integrated QSO spectrum of HE 2158−0107 as observed with the PMAS integral field spectrograph. All prominent emission lines are labelled and the four telluric absorption bands in the red part of the spectrum are marked. The red and yellow curves below the QSO spectrum represent the arbitrarily scaled r- and i-band transmission curves, respectively. The inset highlights the wavelength region of potentially strong stellar absorption lines. The redshifted spectrum of a 5 Gyr old SSP with solar metallicity (Bruzual & Charlot 2003) is overplotted as the red line in the inset for direct comparison and the main chemical species leading to the various absorption lines are labelled. |
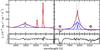 |
Fig. 2 Modelling of the broad Hβ (left panel) and Hα line (right panel). The red line represents the best-fit model to the data (black line) composed of individual Gaussians and a straight to approximate the local continuum. Individual Gaussian components for the Balmer lines are shown as blue lines above the continuum for a visual impression of their respective contribution. Two vertical dotted lines mark the wavelengths of the expected [N ii] λλ6548,6583 lines. The residuals of the best-fit model are displayed in the panels below. Some residuals of the bright Na iλ5893 night-sky line are visible above the broad Hβ line. Two telluric absorption bands of the Earth’s atmosphere are clearly visible at 7600–7700 Å and 8150–8350 Å. |
The synthetic r-band magnitude of the spectrum is brighter by only 0.13 mag than the SDSS photometric r-band magnitude, which may well be caused by the intrinsic variability of the QSO. The Fe ii complexes blue- and redward of Hβ (e.g. Boroson & Green 1992) are very weak and do not contribute significantly to the QSO pseudo-continuum. We find tentative evidence for stellar Mg and Fe absorption lines in the rest-frame wavelength 5120–5310 Å (see inset in Fig. 1). A properly redshifted 5 Gyr old single stellar population (SSP) spectrum (Bruzual & Charlot 2003) matches several spectral features in this wavelength range, although some stellar absorption lines seem to be absent. It is likely that those absorption lines are strongly blended in our low-resolution spectrum with weak narrow emission lines of the QSO, like [Fe vii] λ5158, [Fe vi] λ5176, [N i] λλ5177,5197, or [Fe vii] λ5278. Consequently, the nuclear QSO spectrum probably also contains a small fraction of stellar light from the underlying host galaxy.
3.2. Virial BH mass estimate
Black hole masses of QSOs can be estimated from their single-epoch spectra via the so-called virial method (Peterson & Wandel 2000; Vestergaard 2002). The method combines the empirically derived size-luminosity relation for the BLR, determined via reverberation mapping (e.g. Kaspi et al. 2000; Peterson et al. 2004; Kaspi et al. 2005; Bentz et al. 2006, 2009), and assuming virialised motion of the BLR clouds that can be inferred from the broad line width.
We used the formula also employed by Schulze & Wisotzki (2010),  (1)where σHβ is the line dispersion of the broad Hβ line and L5100 is the continuum luminosity at 5100 Å. Equation (1) is derived from the empirical relation between the BLR size and the continuum luminosity as calibrated by Bentz et al. (2009) combined with the prescription by Collin et al. (2006) to infer the virial motions from σHβ adopting a virial coefficient of 3.85. By modelling the QSO spectrum with multiple Gaussians for the emission lines and a straight line for the local continuum (Fig. 2, left panel), we measured an Hβ line dispersion of σHβ = 2320 ± 20kms-1, excluding any NLR component, and a continuum luminosity of λLλ(5100) = (8.0 ± 0.3) × 1044ergs-1. From those measurements we estimated a BH mass of log (MBH/M⊙) = 8.6 ± 0.3 for HE 2158 − 0107.
Greene & Ho (2005b) derived an alternative MBH calibration based on the broad Hα line luminosity and width, which is less sensitive to host galaxy light contamination and also less susceptible to dust extinction,  (2)We modelled the Hα line with multiple Gaussian components (Fig. 2, right panel) and measured a Hα luminosity of (3.6 ± 0.4) × 1043ergs-1 and a FWHM of 3860 ± 70kms-1 excluding the NLR narrow component. This yields a BH mass of log (MBH/M⊙) = 8.4 ± 0.3 with Eq. (2). Although the broad Hβ line could be adequately approximated by a single Gaussian component, the Hα model required two Gaussian components because of its extended wings that are not seen for Hβ. A difference in the line profiles is expected, because the FWHM of Hβ is systematically broader than Hα (e.g. Greene & Ho 2005b; Schulze & Wisotzki 2010).
Both BH mass estimates differ only by 0.2 dex and are well consistent with each other assuming a typical systematic uncertainty of ~ 0.3 dex for virial MBH estimates. This shows that a high-mass BH powers the QSO nucleus of HE 2158 − 0107. We adopt the average of both estimates, log (MBH/M⊙) = 8.5 ± 0.3, for the rest of this paper.
3.3. Evidence for an exceptionally low NLR gas-phase metallicity
The estimated BH mass for HE 2158 − 0107 implies an expected bulge mass of log (Mbulge/M⊙) = 11.3 ± 0.3 for its host galaxy adopting the empirical MBH-Mbulge relation of Häring & Rix (2004). If the host galaxy has a substantial disc, the total mass of the system would even be higher, depending on the bulge-to-disc ratio. The mass-metallicity relation of galaxies implies that the gas-phase metallicity, usually expressed by the oxygen abundance, increases monotonically with stellar mass, so that we expect an oxygen abundance of 12 + log (O/H) = 9.13 ± 0.2 from the mass-metallicity relation of Tremonti et al. (2004) for the inferred stellar mass of HE 2158 − 0107. However, different calibrations have been used in the literature to determine the oxygen abundance from strong emission lines of H ii nebulae (e.g. Denicoló et al. 2002; Kewley & Dopita 2002; Pettini & Pagel 2004; Kobulnicky & Kewley 2004; Tremonti et al. 2004; Pilyugin & Thuan 2005). Unfortunately, the absolute scale of the derived oxygen abundances strongly depends on the adopted calibration so that the corresponding mass-metallicity relations are also quite different (Liang et al. 2006; Kewley & Ellison 2008; Calura et al. 2009) even though the emission-line ratios are identical. A relative comparison of abundances is therefore only possible when they were obtained with a common calibration.
For the radiation field of an AGN as in the case of HE 2158 − 0107, the oxygen abundance in the NLR region cannot be determined with the same calibrations used for H ii regions. With state-of-the-art photoionisation codes like CLOUDY (Ferland 1996), emission line ratios can be interpreted by assuming a particular abundance pattern of elements, i.e. the solar abundance pattern, and a power-law ionising continuum of the AGN. Various studies reported that for the NLR the [O iii]/Hβ ratio is primarily governed by the ionisation parameter, while the [N ii]/Hα line ratio is mainly determined by the gas-phase metallicity (e.g. Storchi-Bergmann et al. 1998; Groves et al. 2004, 2006). A complication in that interpretation is that oxygen and nitrogen have a different nucleosynthesis. Oxygen is predominantly produced as a primary element in massive (young) stars based on the nucleosynthesis of hydrogen. Nitrogen can be produced similarly as a primary element, but it can also have a secondary origin in intermediate mass (old) stars generated from the original metals of the star (e.g. Matteucci 1986; Pilyugin et al. 2003; Pettini et al. 2008). In this simple picture the ratio of N/O is constant if nitrogen has a primary origin, while it depends on O/H if it has a secondary origin. The secondary nature of nitrogen dominates at high metallicities 12 + log (O/H) > 8.5 (e.g. Vila Costas & Edmunds 1993) where a relation between O/H and N/O can be empirically established. At the centre of massive galaxies the metallicity of the gas is usually much higher than that limit. The linear relation ![Mathematical equation: \begin{equation} \log(\mathrm{N}/\mathrm{O}) = 0.96[12+\log(\mathrm{O}/\mathrm{H})]-9.29\label{eq:N_O} \end{equation}](/articles/aa/full_html/2011/11/aa17596-11/aa17596-11-eq68.png) (3)was obtained by Storchi-Bergmann et al. (1994) from spectroscopic observations of galaxies with a nuclear starburst.
(3)was obtained by Storchi-Bergmann et al. (1994) from spectroscopic observations of galaxies with a nuclear starburst.
Assuming a secondary origin of nitrogen, Storchi-Bergmann et al. (1998) determined a calibration for the oxygen abundances of the NLR by matching the [N ii] λλ6548,6583/Hα ( ≡ x) and [O iii] λλ4960,5007/Hβ ( ≡ y) line ratios with a grid of CLOUDY photoionisation models described by a 2D polynomial of second order, 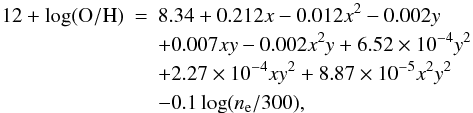 (4)where the dependence on the electron density (ne) was added as an additional term.
Because the oxygen abundance calibration used by Tremonti et al. (2004) is also based on a match to CLOUDY photoionisation models, but for the conditions of H ii regions, the calibration of Storchi-Bergmann et al. (1998) should provide oxygen abundances at roughly the same scale. We verified this by measuring the oxygen abundance of the NLR for all SDSS AGN having log ( [Oiii] /Hβ) > 1.0 and log ( [Nii] /Hα) > − 0.2 using the method of Storchi-Bergmann et al. We found a mean value of 12 + log (O/H) = 8.95 ± 0.25, which matches the expected value for the mass-metallicity relations at a stellar mass of log (M∗) ≈ 10.5, where the mass distribution of AGN host galaxy peaks (Kauffmann et al. 2003), in absolute scale for the Tremonti et al. (2004), Kobulnicky & Kewley (2004), and Kewley & Dopita (2002) calibrations. All the other calibrations are substantially offset from our measured abundance. We are therefore confident in using the mass-metallicity relation of Tremonti et al. as our reference for comparison with the NLR metallicity that we determine below.
The QSO spectrum of HE 2158 − 0107 displays prominent narrow emission lines from the NLR and we included also Gaussian components for the narrow [N ii] λλ6548,6583 emission line doublet to the model of the Hα line (see Fig. 2). However, no trace of the [N ii] λ6583 ([N ii] hereafter) line is visible in the data. It is of course possible that a weak [N ii] line is indeed present and just below our detection limit considering the low spectral resolution and the blending with the underlying broad Hα line. In order to determine a realistic detection limit for the [N ii] line, we performed a Monte-Carlo simulation as described in the appendix. From those simulations we determine a 3σ upper limit of log ( [N ii] /Hα) < − 1.0, or log ( [N ii] /Hα) < −1.2 at 1σ. The location of the NLR of HE 2158 − 0107 in the log ( [O iii] /Hβ) vs. log ( [N ii] /Hα) diagram, the so-called BPT diagnostic diagram (Baldwin et al. 1981), is shown in Fig. 3. The line ratios place the NLR in the domain of AGN ionisation above the Kewley et al. (2001) and Kauffmann et al. (2003) demarcation curves as expected, but at a significant offset from the local population of AGN towards a much lower [N ii]/Hα line ratio. With the abundance calibrations of Storchi-Bergmann et al. (1998) we infer an upper limit of 12 + log (O/H) < 8.4 for the oxygen abundance in the NLR of HE 2158 − 0107 based on the [O iii]/Hβ and [N ii]/Hα line ratios and assuming a canonical electron density for the NLR of ne ~ 1000cm-3. This oxygen abundance corresponds to Z < 0.5Z⊙ and also agrees with the gas-phase metallicity of the Groves et al. (2006) photoionisation models.
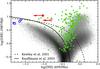 |
Fig. 3 Standard BPT emission-line ratio diagram for HE 2158 − 0107. The measured line ratios of the NLR (filled red circle) and the EELR (opened red circle) are shown for the 3σ limits on log ( [N ii] /Hα) and the length of the arrows are such that their tip corresponds to the 1σ limit. The distribution of emission-line ratios for ~40 000 randomly selected SDSS galaxies are indicated by the grey scale for comparison. Triangle symbols indicate the NLR line ratio for a sample of AGN with low BH masses (Greene & Ho 2007) and blue opened squares represent four candidate low-metallicity AGN in dwarf galaxies as reported by Izotov & Thuan (2008) and Izotov et al. (2010). |
Our judgement that the exceptionally low [N ii]/Hα line ratio is not caused by the blending with the broad Hα line is further supported by line ratios of an extended emission line region (EELR) that we resolved around the QSO (Fig. 4). We employed our software tool QDeblend for the deblending of the QSO and extended emission using an iterative algorithm improving the technique introduced by Christensen et al. (2006). Details on the algorithm can be found in the QDeblend manual1, and its application to the PMAS IFU observation of our entire QSO sample will be described more detailed in Husemann et al. (in prep.). Briefly, a high S/N QSO spectrum from the central spaxel was subtracted from all other spaxels after being scaled to match the broad Balmer lines. Three iterations were performed to empirically decontaminate the QSO spectrum from its host contribution using a co-added spectrum of the 8 spaxels surrounding the central QSO spaxel. We extracted a co-added spectrum from a high surface brightness region south-east of the QSO as indicated in Fig. 4. No broad emission lines are left in the extended spectrum after we applied our QSO-host deblending process, so that the blending of broad and narrow lines is not a problem for the EELR spectrum. The [N ii] doublet is still undetected in this spectrum and we determined a 3σ upper limit of [N ii]/Hα < −0.8 ([N ii]/Hα < −0.94 at 1σ) using the same type of simulation method applied for the QSO spectrum. The emission-line ratios of the EELR are close to the unresolved NLR in the BPT diagram (Fig. 3). It is likely that the AGN is the main ionisation source for the extended emission as well. However, owing to the 0.15 dex lower [O iii]/Hβ line ratio and the upper limit in [N ii]/Hα, we cannot strictly rule out excitation by young massive stars from emission-line diagnostics alone. In either case, the limit on the [N ii]/Hα line ratio implies that the gas-phase metallicity must be low over a region of several kpc, suggesting that the low-metallicity gas is not confined to the circumnuclear region.
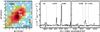 |
Fig. 4 [O iii] light distribution and EELR spectrum for HE 2158 − 0107. Left panel: nucleus-subtracted 40 Å wide [O iii] narrow-band image as extracted from our PMAS datacube. The position of the QSO is highlighted by the white cross. A black box indicates the boundary for the extraction of a co-added spectrum. Right panel: co-added spectrum of the EELR region as defined in the left panel. The expected wavelengths of various emission-lines are indicated by the vertical dotted lines. |
QSO-host decomposition results corrected for systematics.
 |
Fig. 5 Host galaxy images of HE 2158−0107 after 2D QSO-host decomposition with GALFIT. The first column represents the PSF (over)subtracted host images of the best-fit model including a point source only. The PSF subtracted host images and residuals of the best-fit model, including a point source and a de Vaucouleurs profile for the host, are shown in the second and third column, respectively. The radial surface brightness profiles of the data, best-fit model, and their components are presented in the fourth column to highlight the low contrast between nucleus and host. The orientation and position of the PMAS field of view with respect to the QSO is indicated by the black rectangle in the r-band image. A region covering the extended tail analysed in Sect. 4.5 is marked by the blue boundary. |
Only very few other AGN with similarly low oxygen abundances in the NLR gas are known to date. Groves et al. (2006) found only 40 low-metallicity AGN among 23 000 Seyfert 2 galaxies, all of which are in low-mass galaxies. Only two of them have gas-phase metallicities lower than the upper limits of HE 2158 − 0107. Greene & Ho (2007) constructed a sample of low BH mass AGN (MBH < 2 × 10⁶M⊙) and measured the line ratios of the NLR, which are shown in Fig. 3 for comparison. They also found only two AGN with log (Hα/ [N ii] ) < −1.0 in their NLR. Finally, four low-metallicity AGN candidates with log (Hα/ [N ii] ) ~ −1.6 were reported by Izotov & Thuan (2008) and Izotov et al. (2010), all residing in dwarf galaxies with BH masses in the range of the Greene & Ho sample. In contrast to the other AGN considered so far, those candidate AGN display emission-line ratios in the NLR that are well consistent with classical H ii regions powered by massive stars. Therefore, they should be considered as a completely different class of objects.
HE 2158−0107 differs from the above mentioned cases in that it is a luminous QSO with a high-mass BH. It is therefore the first and so far only known proper case of a low-metallicity QSO. Our limiting gas-phase oxygen abundance is 0.7 dex lower than expected for the stellar mass predicted by the BH mass-bulge mass relation. Either the host of HE 2158 − 0107 is an extreme outlier from the mass-metallicity relation of galaxies, or it is strongly offset from the BH mass-bulge mass relation, or even both. We explore the latter aspect in the next section.
4. The multi-colour SED of HE 2158−0107 and its bulge mass
In order to directly constrain the bulge mass and to test whether the host galaxy of HE 2158−0107 is significantly offset from the BH mass-bulge mass relation, we analysed the optical and infrared broad-band images to reconstruct the multi-colour spectral energy distribution (SED) of the host galaxy. To do this, the emission of the QSO and the its host need to be decomposed, which requires a good characterisation of the point spread function (PSF) in each band.
Two bright stars are close to HE 2158−0107, brighter than the QSO by 2 mag and 1 mag in the r-band, respectively. We empirically determined the PSF for each observation from these two stars. Their distances to the QSO of 62 and 76 already caused subtle PSF variations with respect to the PSF at the position of the QSO. These variations are particularly strong for the SOFI image taken with the large-field objective because of coma (Moorwood et al. 1998). To overcome the limitations imposed by the field variations, we analysed their PSF residuals from another star only 18 away from the QSO, which has a similar r-band magnitude. We used the residuals within a radius of 2 to make an empirical corrections to our two PSF stars. Because all the stars in the SDSS field are at least 0.5 mag fainter than the QSO in the u-band, we were not able to construct a useful PSF in this band and excluded it from our analysis.
4.1. Results of the QSO-host decomposition
We employed GALFIT v3.0.2 (Peng et al. 2002, 2010) to decompose the host galaxy and the point-like QSO of HE 2158−0107 by modelling the observed 2D surface brightness (SB) distribution in the SDSS and SOFI broad-band images with an appropriate model. We considered two different models. Model 1 consists of a single PSF, only to check whether any detectable signal from the host galaxy remains in the residuals even when the QSO contribution is over-subtracted. Model 2 is composed of a de Vaucouleur profile for the presumably bulge-dominated host and a PSF component for the QSO. After trying other models as well, the host turned out to be so faint that we fixed the SB model of the host to the de Vaucouleur profile to increase the robustness of the GALFIT model and the recovered host galaxy magnitudes (e.g. Sánchez et al. 2004; Kim et al. 2008). Although other SB models for the host galaxy including a disc component might be possible, we emphasise that those models would inevitably lead to an even fainter bulge component. Hence, our approach provides a robust upper limit for the bulge luminosity.
In Fig. 5 we present the results of the QSO-host decomposition. In all cases except for the H-band we resolved the underlying host galaxy and recovered the structural properties for our assumed host model. Interestingly, the r- and i-band host images reveal an extended tail in the light distribution towards the south-east that matches with the EELR seen in our PMAS data. We find that the ellipticity (e ≡ 1 − b/a) and effective radius re of the best-fit de Vaucouleur profile are larger in the r- and i-bands than in the g- and z-bands. This is expected if line emission of the EELR significantly contributes to the signal in these particular bands (see Fig. 1). In order to estimate the emission-line contribution of the EELR to the r- and i-bands, we synthesised a pure emission-line spectrum for the EELR based on its [O iii] flux of (150 ± 30) × 10-16ergs-1cm-2 within an aperture of 3 centred on the QSO and the observed line ratios. From the synthetic EELR spectrum we determined an emission-line brightness in the r- and i-bands of 20.5 ± 0.2 mag and 21.6 ± 0.2 mag, respectively. This corresponds to a substantial emission-line contribution of 18 ± 7% within the central 3 of the r-band and a rest-frame [O iii] equivalent width (EW) of EW( [O iii] ) = 170 ± 70 Å.
Owing to the apparently high nucleus-to-host ratio of > 10 in the z-band and the small apparent size of the host galaxy, it is furthermore import to estimate the systematic errors and to clean the structural parameters and magnitudes from systematic effects. We performed a suite of Monte-Carlo simulations for various nucleus-to-host ratios and five different effective radii for each band. We used one empirical PSF to generate 200 mock images for a given set of parameters and analysed the image subsequently with the other empirical PSF. Detailed information about these simulations are given in the appendix.
The GALFIT results of the best-fit models are listed in Table 2 after correcting them for Galactic extinction and for the systematic biases recovered by the simulation. We determined a 3σ upper limit for the host magnitude of mhost > 18.19 mag in the H-band from our simulation. We withdrew the g-band from this analysis because the QSO-host decomposition appears to be significantly affected by an intrinsic PSF mismatch between the stars and the QSO in this band. The SEDs of the QSO and the stars are so different in the blue that their “effective” PSFs are heavily affected by the wavelength dependence of the seeing. To quantify this effect, we simulated synthetic ugriz images. For simplicity we assumed a symmetric Gaussian profile for the PSF with a FWHM that is a smooth function of wavelength as constrained by the values in Table 1. Assuming a power-law spectrum for the QSO and a matched stellar spectrum for the stars, we constructed monochromatic images for each wavelength (stepsize 1 Å). Finally, the band images were created by summing up the monochromatic images with its contribution set by the transmission curve of the band. Afterwards we scaled the stellar image to match the QSO image in the brightest pixel and subtracted it. We found a residual flux of the order of 2% for the u- and g-bands, but only <0.1% in the r-, i-, and z-bands. Because the nucleus-to-host ratio for HE 2158 − 0107 is already 10 in the r-band, this residual flux solely caused by the PSF mismatch is quite significant.
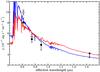 |
Fig. 6 Host galaxy SED of HE 2158 − 0107 within a circular aperture of 3. Open and filled symbols correspond to the SED with and without the contribution of the emission lines in the r- and i-band. The best-fit 100 Myr SSP model (blue line) and composite 100 Myr+11 Gyr SSP model (red line) taken from the Bruzual & Charlot (2003) library of spectra are shown for comparison. |
4.2. An SED-based stellar mass estimate
After taking into account the systematics of the 2D QSO-host decomposition, the emission-line contribution, and the foreground Galactic extinction in the different bands, we show the SED of the host galaxy from the rizH photometry in Fig. 6. Even after subtracting the EELR contribution from the SED, the shape of the SED appears to be very blue. Scattered light of the QSO owing to large amounts of dust within the host could significantly contribute to the apparent host light in rest-frame blue and UV bands (e.g. Tadhunter et al. 1992; Zakamska et al. 2006). We therefore looked at the GALEX UV images of the Medium Imaging Survey for HE 2158 − 0107. They are consistent with a point source without any asymmetry that would indicate large-scale scattered emission. Because the low gas-phase metallicity suggests a low dust content anyway, probably a young stellar population as often found in bulge-dominated QSO hosts (e.g. Kauffmann et al. 2003; Jahnke et al. 2004; Sánchez et al. 2004) accounts for the blue colour.
In order to constrain the stellar population, we modelled the SED with a grid of SSP model spectra from Bruzual & Charlot (2003) with ages in the range of 5 Myr to 17 Gyr and 0.2Z⊙, 0.4Z⊙, 1Z⊙ and 2Z⊙ metallicities. A χ2 test was applied to check which SSPs models were consistent with the photometry at a 95% confidence level. We incorporated the upper limit in the H-band by assuming a value of half the limit and a 3σ error matching with the 3σ limit. Given the few photometric data points and their considerable errors, we found that formally all SSPs with ages younger than 1 Gyr are consistent with the data. The best-fit SSP of solar metallicity has an age of 100 Myr. From all matching SSP models we derived a minimum stellar mass of Mbulge > 3.0 × 10⁸M⊙. This extremely low value of course just constrains the young stellar population and is therefore useless for our purposes.
Although the light of the host galaxy is apparently dominated by young stars, the mass of the system could still be dominated by an underlying old stellar population. Consequently, we determined how much stellar mass in an old 11 Gyr SSP can be added to the stellar mass of the young SSP, so that the composite spectrum still obeys the 3σ upper limit of Lbulge,H < 4.5 × 10¹⁰L ⊙ ,H in the H-band. From all possible combinations we inferred a maximum total stellar mass for the host galaxy of Mbulge < 3.4 × 10¹⁰M⊙.
4.3. Additional mass constraints from the gas kinematics
In Fig. 7 we present the [O iii] velocity field of the EELR, which we derived by modelling the [O iii] doublet lines in each spaxel of the nucleus-subtracted datacube with Gaussian profiles. While quite noisy, the overall appearance of the velocity field is consistent with ordered rotation. We constructed a synthetic longslit curve from the velocity map along the apparent kinematic major axis from all spaxels within away from it. The radial Doppler motion of the gas was estimated using the redshift of the spatially unresolved [O iii] line as the reference for the QSO rest-frame. From the velocity curve along the major axis we inferred a maximum radial velocity of vr = 80 ± 20kms-1 at a radius of 2 from the nucleus.
Assuming that the velocity field is caused by a dynamically cold rotating gas disc within the bulge of the host galaxy, we can infer a rough estimate of the dynamical mass Mdyn via 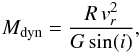 (5)where i is the inclination of the gas disc with respect to our line-of-sight, R is the radius at which the radial velocity vr is measured, and G is the gravitational constant. The maximum of the radial velocity is reached somewhere between 2 (7 kpc) and 1 (3.5 kpc), at which nearly all the mass of the bulge should be included considering its low effective radius of re ~ 1.4kpc in the z-band. Because the host galaxy has no prominent stellar disc, we used the axis ratio of the EELR b/a = 0.59 to estimate an inclination of i = 55. We assigned a large error of ± 30 to this inclination estimate because the unknown geometry of the AGN ionisation cones with respect to the presumed gas disc can introduce a large systematic uncertainty to the observed b/a ratio (Mulchaey et al. 1996). With these very crude assumptions we estimated a possible range in Mdyn of ~ 3 × 10⁹–4 × 10¹⁰M⊙, which is very well consistent with our SED-based upper limit on the stellar mass.
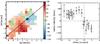 |
Fig. 7 Velocity field of the [O iii] EELR around HE 2158 − 0107. Left panel: radial velocity map inferred from the [O iii] emission line Doppler shift with respect to the rest-frame of the QSO. The black solid line represents roughly the apparent kinematic major axis. Right panel: radial velocity curves extracted from the velocity map along the kinematic major axis (black open circles). |
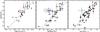 |
Fig. 8 Left panel: MBH-Lbulge relation for the H-band. The black triangles are measurements from Marconi & Hunt (2003) for local galaxies and the dashed line is their best-fit relation. Our 3σ upper limit on LH,bulge for HE 2158 − 0107 is shown as the red open circle. Middle panel: MBH-Mbulge mass relation. The black squares correspond to the measurements of Häring & Rix (2004) with their best-fit relation shown as the dashed line. An SED based 3σ upper limit for the stellar mass of the HE 2158 − 0107 is indicated by the red open circle. An independent estimate based on the bulge size in the z-band using the size-mass relation by Shen et al. (2003) is shown as the blue open triangle. The light grey area represents the possible range in Mdyn of the bulge based on the ionised gas kinematics assuming rotational motion of a cold gas disc. Right panel: MBH-σ∗ relation for local galaxies with dynamical MBH measurements. Measurements by Gültekin et al. (2009) are shown as black round symbols and the dashed line indicates their best-fit relation. We used the line dispersion of the [O iii] line (green open square) in the unresolved NLR of HE 2158 − 0107 as a surrogate for σ∗, following the suggestion by Nelson (2000). |
We also tried to estimate the velocity dispersion σ∗ of the bulge. Although we cannot directly determine σ∗ from the PMAS spectrum of the QSO, Nelson & Whittle (1996) found that in Seyfert galaxies the dispersion of the [O iii] emission line in an unresolved NLR is correlated with σ∗. Thus, Nelson (2000) suggested that σ [Oiii] may be used as a surrogate for σ∗. The [O iii] line in the unresolved NLR of HE 2158−0107 can be described by a single Gaussian profile with a line dispersion of σ [Oiii] = 128 ± 11kms-1 after subtracting the instrumental resolution in quadrature.
4.4. Is HE 2158 − 0107 an outlier from the BH-bulge relations?
Above we collected several independent estimates for the bulge properties of the QSO host. Figure 8 highlights the position of HE 2158 − 0107 in comparison to the MBH-Lbulge,H relation of Marconi & Hunt (2003) (left panel), the MBH-Mbulge relation of Häring & Rix (2004), and the MBH-σ∗ relation studied by Gültekin et al. (2009). We find that this QSO host is offset from the local scaling relations in all three cases.
The bulge luminosity Lbulge,H is lower by more than 0.6 dex than the value indicated by the relation. One advantage of the H-band is that the K-correction (e.g. Oke & Sandage 1968; Hogg et al. 2002) is almost negligible (e.g. Mannucci et al. 2001; Chilingarian et al. 2010) up to z ~ 0.5 and largely independent of the galaxy type. We therefore do not expect that the offset is caused by a systematic effect due to the redshift. Because we adopted a robust 3σ upper limit for Lbulge,H, the true offset from the relation may even be substantially larger.
Clearly, our estimate for Mbulge from the SED is tied to the upper limit in Lbulge,H and thus appears similarly offset from the MBH-Mbulge relation2 (middle panel of Fig. 8). But also the estimated dynamical mass from the extended gas kinematics – while uncertain – agrees with the upper limit on stellar mass. Furthermore, the small apparent size of the bulge measured in the z-band supports the notion of an under-massive bulge with Mbulge = (1.4 ± 0.6) × 1010M⊙ based on the empirical size-mass relation of bulge-dominated galaxies (Shen et al. 2003, 2007). It suggests that the bulge of HE 2158 − 0107 could differ significantly from the MBH-Mbulge relation. Deeper high-spatial resolution photometry in the infrared and optical emission-line free bands are required, however to accurately determine the SED of the host galaxy and to pin down the bulge luminosity and mass.
The offset in the BH mass-bulge relations appears to be most conspicuous in σ∗. The measured value of σ [Oiii] is about half of the expected stellar velocity dispersion (σ∗ = 245 ± 44kms-1) from the MBH-σ∗ relation at the BH mass of HE 2158 − 0107 (log (MBH/M⊙) = 8.5 ± 0.3). Conversely, the measured velocity dispersion would correspond to a BH mass of MBH = 2 × 10⁷M⊙ adopting the MBH-σ∗ relation of Gültekin et al. (2009), lower than the expected value by more than an order of magnitude. The discrepancy remains high even when we account for a potential intrinsic offset Δσ = log (σ∗) − log (σ [Oiii] ) = 0.11dex as reported by Ho (2009). However, the robustness of σ [Oiii] as a surrogate for σ∗ is strongly debated as the scatter in the relation is much higher for σ [Oiii] than for σ∗ (Shields et al. 2003; Boroson 2005; Greene & Ho 2005a).
Each measurement has some drawbacks and would certainly be considered inconclusive individually. But remarkably, all the independent results agree with each other and point in the same direction. Nevertheless, the offset of HE 2158 − 0107 from the MBH-bulge relations is still formally consistent with the intrinsic scatter of the scaling relations except for the velocity dispersion. So far we can refer to HE 2158 − 0107 only as a candidate outlier from the MBH-bulge relations. The fact that the QSO spectrum might be particularly suited to directly measure the stellar velocity dispersion from a high S/N spectrum provides a good opportunity to verify and pin down the offset in the future.
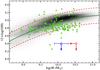 |
Fig. 9 Gas-phase oxygen abundance against total stellar mass. The grey-scale image corresponds to a 2D histogram as constructed by Tremonti et al. (2004) from the SDSS MPA/JHU galaxy catalogues. The red solid line represents the corresponding best-fit mass-metallicity relation for which the dashed lines indicate roughly its 3σ uncertainty. Most of the AGN hosts among the sample of Greene & Ho (2007) are within or slightly below this mass-metallicity relation. The blue open triangle and the red open circle highlight the exceptionally low metallicity of HE 2158 − 0107 with respect to the mass-metallicity relation, for which the stellar mass was estimated from the bulge size and the host SED, respectively. |
4.5. The origin of the low-metallicity gas
While there is strong evidence for a significantly lower mass of the host galaxy than what would be expected from MBH, its mass is still too high to easily explain the low metallicity of the gas in the NLR and EELR. The mass-metallicity relation decreases only by 0.2 dex from 1011M⊙ to 1010M⊙ in stellar mass as shown in Fig. 9. Therefore, the gas-phase NLR metallicity of HE 2158 − 0107 is still far below the mass-metallicity relation at the estimated stellar mass (limit) for this object. For comparison we also estimated stellar masses and gas-phase oxygen abundances for the AGN sample of Greene & Ho (2007). We computed the approximate stellar masses from the absolute g-band host magnitudes with a mass-to-light ratio based on the g − r colour (Bell et al. 2003). Because only the total g − r colour was reported by Greene & Ho (2007), but not that of the host, we assumed g − r ~ 0.4 as a typical value for blue-sequence galaxies (Blanton et al. 2003). We estimated the gas-phase oxygen abundance with the calibration of Storchi-Bergmann et al. (1998) only when the line ratios were above the Kewley et al. (2001) demarcation line in the BPT diagram (cf. Fig. 3). For classical H ii regions among the sample (i.e. objects below the Kauffmann et al. 2003, line) we used the abundance calibration of Pettini & Pagel (2004) and converted the measured oxygen abundance to the scale of the Tremonti et al. calibration following the prescription of Kewley & Ellison (2008). Very few of the Greene & Ho low BH mass AGN (MBH < 106M⊙) have oxygen abundances below 12 + log (O/H) < 8.5, of which only three seem to have stellar masses comparable with that of HE 2158 − 0107, whereas all the others are consistent with or only slight below the mass-metallicity relation. This highlights the exceptionally low gas-phase metallicity in HE 2158 − 0107 compared to other host galaxies of luminous AGN that have even much lower BH masses. We suspect that the EELR with its intriguing tail-like geometry is the key for understanding the unusual properties of HE 2158 − 0107.
The [O iii] light distribution extends beyond the PMAS field of view, but we can follow the structure in the Stripe 82 r- and i-band images out to 30 kpc projected distance from the host galaxy. We determined the emission-line contribution to the broad-band images from a small area at the south-east part of the EELR (see Fig. 5), which is still covered by the PMAS field of view but not contaminated by host galaxy light. We constructed a synthetic emission-line spectrum for that area of the tail including the [O iii], Hβ and Hα lines based on the observed [O iii] flux, assuming an [O iii]/Hβ line ratio of 7 and a Balmer decrement of 2.86. Furthermore, we assumed an average [O ii]/[O iii] line ratio of the order of 1/3 (e.g. Villar-Martín et al. 2008) to roughly predict the emission-line contamination in the g-band. The surface brightness values of the tail are reported in Table 3 for the SDSS photometry and the synthetic emission line spectrum. The corresponding SED is shown in Fig. 10. We find that the emission lines actually account for 57% of the flux in the r-band, whereas the Hα line account for 25% of the i-band flux. The emission lines are clearly dominating the r-band flux, but an underlying continuum must also be present with a corresponding [O iii] rest-frame EW of EW( [O iii] ) = 1120 ± 500 Å. Such a high EW for the [O iii] line was only observed in the integrated light of 2 out of 256 type-2 QSOs (Zakamska et al. 2003). If the EELR is indeed powered by star formation, only blue compact dwarf galaxies reach these high equivalent widths in the [O iii] line (e.g. Thuan & Izotov 2005).
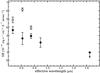 |
Fig. 10 SED of the extended tail close to HE 2158 − 0107. The surface brightness of a certain region centre on the extended tail (cf. Fig. 5) is shown at the effective wavelength of the corresponding passband. The initial surface brightnesses are indicated as open symbols, whereas the filled symbols denote the surface brightness after subtraction of the emission-line contribution. |
Photometry of the extended tail.
One explanation for this intriguing feature dominated by gaseous emission may be that it is a tidal tail from a recent galaxy interaction. This scenario would be attractive for HE 2158 − 0107, because the oxygen abundance in interacting galaxies has been found to be systematically lower at a given stellar mass (Ellison et al. 2008; Michel-Dansac et al. 2008; Sol Alonso et al. 2010), presumably because of inflowing low-metallicity gas from larger radii. Among those, the strongest dilution of metallicities has been observed and theoretically predicted for major mergers (Rupke et al. 2010; Montuori et al. 2010). However, while this process can effectively funnel low-metallicity gas towards the galaxy nucleus, we find no signatures for a recent or ongoing major merger from the stellar light distribution at our spatial resolution of 1 kpc/pixel. Pointing to a different stage of galaxy interactions, Villar-Martín et al. (2010) recently reported the detection of a gas-rich tidal bridge of 180 kpc length between a type 2 QSO (z = 0.399) and a companion galaxy. The gas along that bridge is ionised through ongoing star formation, but the QSO is capable of ionising the gas in its vicinity up to ~35 kpc distance. The EW of the [O iii] emission and the associated low gas-phase metallicity along the tidal bridge of that interacting system are consistent with the EELR properties of HE 2158 − 0107. However, we cannot identify a potential companion galaxy around HE 2158 − 0107 that could be responsible for this tail.
To put constraints on the mass of a potential interacting companion, we estimated the ionised gas mass from the emission line luminosity of the entire EELR. Following the prescription given in Osterbrock & Ferland (2006) and assuming Case B recombination, a low-density limit and a gas temperature of T ≈ 10000 K for ionised nebulae, the ionised gas mass is given by  (6)where ne is the electron density of the gas. Because ne cannot be estimated from our data, we assume a density of the order of 100cm-3, which is a typical value for bright EELR around QSOs on kpc scales (e.g. Stockton et al. 2002). The [O iii] luminosity of the entire EELR is L [Oiii] = 2.1 × 1042ergs-1, which corresponds to an Hβ luminosity of LHβ = 3 × 1041ergs-1 assuming an average [O iii]/Hβ ratio of 7 throughout the entire EELR. Under these assumptions we estimate an ionised gas mass of roughly Mion ≈ 3 × 10⁷M⊙. This is not a large amount of ionised gas even though cold molecular and neutral gas could increase the total gas mass by an order of magnitude. A tidally disrupted small gas-rich companion would then be sufficient to account for the observed ionised gas mass.
Considering the exceptionally low metallicity of the gas in the NLR of this luminous QSO, the accretion of external and nearly pristine gas from the environment is the most plausible explanation to account for the strong dilution of the gas-phase oxygen abundance at the galaxy centre. Our limits on the oxygen abundance are indeed in a regime where nitrogen may be expected to be predominantly of a primary origin for which the used calibration of Storchi-Bergmann et al. is not valid any more, but would then even strengthen our suggestion that the inflowing gas is nearly pristine. Whether the infall of gas is caused by interactions with small satellite galaxies or by the “smooth” accretion of gas is difficult to distinguish, because our observations do not provide enough spatial resolution to resolve substructures in the EELR and are not deep enough to reliably detect any related underlying stellar continuum.
5. Discussion and conclusions
Combining PMAS integral field spectroscopy and multi-colour broad band images, we discovered several interesting properties of the luminous QSO HE 2158−0107. We found strong evidence for a sub-solar metallicity of its NLR. Only very few AGN are currently known to have such low NLR metallicities, and all of them are low mass system with much lower BH masses than the value found for HE 2158−0107, log (MBH/M⊙) = 8.5 ± 0.3. This QSO clearly is a highly unusual object at least at low redshift.
Another interesting property of this QSO is that its host galaxy appears to be offset from basically all known BH-bulge relations established for local inactive galaxies. The stellar mass and H-band luminosity, inferred from the SED of the bulge-dominated host, are both at least 0.6 dex lower than expected, which is independently supported by the kinematics of the ionised gas. Clearly, the offset for a single object can always be explained by chance given the intrinsic scatter of the relation, but the low stellar mass estimated from the size-mass relation of galaxies and the low-velocity dispersion of the nuclear gas suggest that HE 2158 − 0107 is an outlier from the local MBH-bulge relations. We tentatively note that the estimated offset from the relation matches, by order of magnitude, with the systematic offsets found at higher redshifts (e.g. Peng et al. 2006; Treu et al. 2007; Schramm et al. 2008; Merloni et al. 2010). Jahnke & Macciò (2011) recently studied with numerical simulations how the BH mass-bulge relations may get established over cosmic time. They found that merging of galaxies in a ΛCDM universe alone is sufficient to produce a tight relation at z = 0, even if the BH and bulge masses are initially uncorrelated. Indeed, the local relation would have a much lower scatter than actually observed if no additional physical processes operate that increase the scatter. Therefore, it is important to understand the physical mechanisms that lead to the observed scatter in the BH mass-bulge relations. It may be that HE 2158 − 0107 is currently offset from the relation through such a process or event that influences the relative growth of BH and bulges.
Whether or not the low-metallicity gas in this object is causally connected to the higher-than-expected MBH/Mbulge ratio is a key question. A striking feature of HE 2158 − 0107 is its large EELR with a tail-like geometry extending out to 30 kpc from the QSO. Extended emission line regions are common around radio-loud QSOs and are well-studied. However, it is still controversial whether they are produced by tidal debris from interacting galaxies, inflated by galactic superwinds, or whether they may also represent smoothly accreted cold gas from the environment (e.g. Stockton & MacKenty 1987; Fabian et al. 1987; Kereš et al. 2005; Stockton et al. 2006; Fu & Stockton 2009). In the case of our radio-quiet QSO, a galactic superwind can be excluded with high confidence, because the EELR kinematics are fairly quiescent and a large-scale radio jet is absent. A major merger origin of the extended tail is also unlikely considering its low ionised gas mass and the lack of obvious major merger signatures in the continuum. Instead we propose that the accretion of external low-metallicity gas explains the exceptional properties of this QSO and its host galaxy. This process supplies fuel for the growth of the bulge and presumably also of the BH.
The details of the presumed accretion process remain difficult to assess with our observations. One option is that the material is accreted from one or possibly several low-metallicity dwarf galaxies in a sequence of minor merger events. If so, this process must have been going on sufficiently long for substantial amounts of low-metallicity gas to reach the NLR of the QSO. An alternative, but also more speculative possibility is the smooth accretion of gas directly from the intergalactic medium, which would naturally explain the observed low metallicity of the gas. A fraction of the accreted gas needs to be dense enough to overcome the virial shock while falling onto the galaxy and to remain at relatively cool temperatures ~104 K (e.g. Birnboim & Dekel 2003; Kereš et al. 2005), which would then light up as an EELR. This process is theoretically predicted, but observational evidence for its existence is still rare with only a few candidate detections (Giavalisco et al. 2011; Ribaudo et al. 2011), also because the phenomenon is expected to be more common at high redshift than in the local universe. To shed more light on this question, much deeper spectra covering the entire optical window are needed to turn our current limits into robust abundance measurements that can then be directly compared with those of dwarf galaxies. In this respect a study of the stellar metallicity of the host galaxy via absorption lines appears much more difficult given its compactness and the blending with the QSO. On the other hand, the QSO provides a bright background source to measure abundance of different elements like O, N and C directly from rest-frame ultraviolet metal absorption lines of the gas that could be compared with the abundance pattern for dwarf galaxies or expectations for the inter galactic medium at this low redshift.
Independently of the question whether the accretion process is “smooth” or “clumpy”, in our preferred interpretation HE 2158 − 0107 represents a particular phase of substantial galaxy and BH growth that can be observationally linked with the accretion of external gas. A fundamental difference in the relative BH and bulge growth might potentially occur when a BH is stochastically fed by an intrinsic gas reservoir within its host galaxy in contrast to this process where large amounts of nearly pristine gas are dumped onto the galaxy. More detailed observations are certainly needed to further constrain the properties of this intriguing object and to elucidate on its importance as a “laboratory” for studying such a particular phase in the evolution of massive galaxies.
Any stellar population model that includes contributions from TP-AGB stars (e.g. Maraston 2005) will result in lower stellar masses compared to the Bruzual & Charlot models used here. In this case the offset of HE 2158 − 0107 from the general mass-scaling relation would even be increased, hence our use of Bruzual & Charlot (2003) is conservative in this respect.
Acknowledgments
We thank the anonymous referee for valuable comments and suggestions that improved the quality of the present paper. We are grateful to Jakob Walcher for sharing his knowledge and experience with stellar population modelling. B.H. and L.W. acknowledge financial support by the DFG Priority Program 1177 “Witnesses of Cosmic History: Formation and evolution of black holes, galaxies and their environment”, grant Wi 1369/22. K.J. acknowledges support through the DFG Emmy Noether-Program, grant JA 1114/3-1. Funding for the SDSS and SDSS-II was provided by the Alfred P. Sloan Foundation, the Participating Institutions, the National Science Foundation, the US Department of Energy, the National Aeronautics and Space Administration, the Japanese Monbukagakusho, the Max Planck Society, and the Higher Education Funding Council for England. The SDSS was managed by the Astrophysical Research Consortium for the Participating Institutions. This research has made use of the NASA/IPAC Extragalactic Database (NED) which is operated by the Jet Propulsion Laboratory, California Institute of Technology, under contract with the National Aeronautics and Space Administration. For the preparation of this paper we have made used of the cosmology calculator “CosmoCalc” (Wright 2006).
References
- Adelman-McCarthy, J. K., Agüeros, M. A., Allam, S. S., et al. 2008, ApJS, 175, 297 [NASA ADS] [CrossRef] [Google Scholar]
- Asplund, M., Grevesse, N., & Sauval, A. J. 2005, in Cosmic Abundances as Records of Stellar Evolution and Nucleosynthesis, ed. T. G. Barnes III, & F. N. Bash, ASP Conf. Ser., 336, 25 [Google Scholar]
- Baldwin, J. A., Phillips, M. M., & Terlevich, R. 1981, PASP, 93, 5 [NASA ADS] [CrossRef] [EDP Sciences] [Google Scholar]
- Barth, A. J., Greene, J. E., & Ho, L. C. 2008, AJ, 136, 1179 [NASA ADS] [CrossRef] [Google Scholar]
- Becker, R. H., White, R. L., & Helfand, D. J. 1995, ApJ, 450, 559 [NASA ADS] [CrossRef] [Google Scholar]
- Bell, E. F., McIntosh, D. H., Katz, N., & Weinberg, M. D. 2003, ApJS, 149, 289 [NASA ADS] [CrossRef] [Google Scholar]
- Bennert, N., Falcke, H., Schulz, H., Wilson, A. S., & Wills, B. J. 2002, ApJ, 574, L105 [NASA ADS] [CrossRef] [Google Scholar]
- Bennert, N., Jungwiert, B., Komossa, S., Haas, M., & Chini, R. 2006a, A&A, 459, 55 [NASA ADS] [CrossRef] [EDP Sciences] [Google Scholar]
- Bennert, N., Jungwiert, B., Komossa, S., Haas, M., & Chini, R. 2006b, A&A, 456, 953 [NASA ADS] [CrossRef] [EDP Sciences] [Google Scholar]
- Bentz, M. C., Peterson, B. M., Pogge, R. W., Vestergaard, M., & Onken, C. A. 2006, ApJ, 644, 133 [NASA ADS] [CrossRef] [Google Scholar]
- Bentz, M. C., Peterson, B. M., Netzer, H., Pogge, R. W., & Vestergaard, M. 2009, ApJ, 697, 160 [Google Scholar]
- Birnboim, Y., & Dekel, A. 2003, MNRAS, 345, 349 [NASA ADS] [CrossRef] [Google Scholar]
- Blanton, M. R., Hogg, D. W., Bahcall, N. A., et al. 2003, ApJ, 594, 186 [NASA ADS] [CrossRef] [Google Scholar]
- Boroson, T. 2005, AJ, 130, 381 [NASA ADS] [CrossRef] [Google Scholar]
- Boroson, T. A., & Green, R. F. 1992, ApJS, 80, 109 [NASA ADS] [CrossRef] [Google Scholar]
- Bruzual, G., & Charlot, S. 2003, MNRAS, 344, 1000 [NASA ADS] [CrossRef] [Google Scholar]
- Calura, F., Pipino, A., Chiappini, C., Matteucci, F., & Maiolino, R. 2009, A&A, 504, 373 [NASA ADS] [CrossRef] [EDP Sciences] [Google Scholar]
- Chilingarian, I. V., Melchior, A., & Zolotukhin, I. Y. 2010, MNRAS, 405, 1409 [NASA ADS] [CrossRef] [Google Scholar]
- Christensen, L., Jahnke, K., Wisotzki, L., & Sánchez, S. F. 2006, A&A, 459, 717 [NASA ADS] [CrossRef] [EDP Sciences] [Google Scholar]
- Collin, S., Kawaguchi, T., Peterson, B. M., & Vestergaard, M. 2006, A&A, 456, 75 [NASA ADS] [CrossRef] [EDP Sciences] [Google Scholar]
- Denicoló, G., Terlevich, R., & Terlevich, E. 2002, MNRAS, 330, 69 [NASA ADS] [CrossRef] [Google Scholar]
- Ellison, S. L., Patton, D. R., Simard, L., & McConnachie, A. W. 2008, AJ, 135, 1877 [NASA ADS] [CrossRef] [Google Scholar]
- Fabian, A. C., Crawford, C. S., Johnstone, R. M., & Thomas, P. A. 1987, MNRAS, 228, 963 [NASA ADS] [Google Scholar]
- Fan, X., Strauss, M. A., Schneider, D. P., et al. 2003, AJ, 125, 1649 [NASA ADS] [CrossRef] [Google Scholar]
- Ferland, G. J. 1996, Hazy, A Brief Introduction to Cloudy 90, ed. G. J. Ferland [Google Scholar]
- Fu, H., & Stockton, A. 2009, ApJ, 690, 953 [NASA ADS] [CrossRef] [Google Scholar]
- Giavalisco, M., Vanzella, E., Salimbeni, S., et al. 2011, ApJ, accepted [arXiv:1106.1205] [Google Scholar]
- Gilbank, D. G., Baldry, I. K., Balogh, M. L., Glazebrook, K., & Bower, R. G. 2010, MNRAS, 405, 2594 [NASA ADS] [Google Scholar]
- Greene, J. E., & Ho, L. C. 2005a, ApJ, 627, 721 [NASA ADS] [CrossRef] [Google Scholar]
- Greene, J. E., & Ho, L. C. 2005b, ApJ, 630, 122 [NASA ADS] [CrossRef] [Google Scholar]
- Greene, J. E., & Ho, L. C. 2007, ApJ, 670, 92 [NASA ADS] [CrossRef] [Google Scholar]
- Groves, B. A., Dopita, M. A., & Sutherland, R. S. 2004, ApJS, 153, 9 [NASA ADS] [CrossRef] [Google Scholar]
- Groves, B. A., Heckman, T. M., & Kauffmann, G. 2006, MNRAS, 371, 1559 [NASA ADS] [CrossRef] [Google Scholar]
- Gültekin, K., Richstone, D. O., Gebhardt, K., et al. 2009, ApJ, 698, 198 [NASA ADS] [CrossRef] [Google Scholar]
- Hamann, F., & Ferland, G. 1993, ApJ, 418, 11 [NASA ADS] [CrossRef] [Google Scholar]
- Hamann, F., & Ferland, G. 1999, ARA&A, 37, 487 [NASA ADS] [CrossRef] [Google Scholar]
- Häring, N., & Rix, H.-W. 2004, ApJ, 604, L89 [NASA ADS] [CrossRef] [Google Scholar]
- Ho, L. C. 2009, ApJ, 699, 638 [NASA ADS] [CrossRef] [Google Scholar]
- Hogg, D. W., Baldry, I. K., Blanton, M. R., & Eisenstein, D. J. 2002 [arXiv:astro-ph/0210394] [Google Scholar]
- Husemann, B., Wisotzki, L., Sánchez, S. F., & Jahnke, K. 2008, A&A, 488, 145 [NASA ADS] [CrossRef] [EDP Sciences] [Google Scholar]
- Izotov, Y. I., & Thuan, T. X. 2008, ApJ, 687, 133 [NASA ADS] [CrossRef] [Google Scholar]
- Izotov, Y. I., Guseva, N. G., Fricke, K. J., et al. 2010, A&A, 517, A90 [NASA ADS] [CrossRef] [EDP Sciences] [Google Scholar]
- Jahnke, K., & Macciò, A. V. 2011, ApJ, 734, 92 [NASA ADS] [CrossRef] [Google Scholar]
- Jahnke, K., Kuhlbrodt, B., & Wisotzki, L. 2004, MNRAS, 352, 399 [NASA ADS] [CrossRef] [Google Scholar]
- Kaspi, S., Smith, P. S., Netzer, H., et al. 2000, ApJ, 533, 631 [NASA ADS] [CrossRef] [Google Scholar]
- Kaspi, S., Maoz, D., Netzer, H., et al. 2005, ApJ, 629, 61 [NASA ADS] [CrossRef] [Google Scholar]
- Kauffmann, G., Heckman, T. M., Tremonti, C., et al. 2003, MNRAS, 346, 1055 [Google Scholar]
- Kereš, D., Katz, N., Weinberg, D. H., & Davé, R. 2005, MNRAS, 363, 2 [NASA ADS] [CrossRef] [Google Scholar]
- Kewley, L. J., & Dopita, M. A. 2002, ApJS, 142, 35 [NASA ADS] [CrossRef] [Google Scholar]
- Kewley, L. J., & Ellison, S. L. 2008, ApJ, 681, 1183 [NASA ADS] [CrossRef] [Google Scholar]
- Kewley, L. J., Dopita, M. A., Sutherland, R. S., Heisler, C. A., & Trevena, J. 2001, ApJ, 556, 121 [Google Scholar]
- Kim, M., Ho, L. C., Peng, C. Y., Barth, A. J., & Im, M. 2008, ApJS, 179, 283 [NASA ADS] [CrossRef] [Google Scholar]
- Kobulnicky, H. A., & Kewley, L. J. 2004, ApJ, 617, 240 [NASA ADS] [CrossRef] [Google Scholar]
- Liang, Y. C., Yin, S. Y., Hammer, F., et al. 2006, ApJ, 652, 257 [NASA ADS] [CrossRef] [Google Scholar]
- Mannucci, F., Basile, F., Poggianti, B. M., et al. 2001, MNRAS, 326, 745 [NASA ADS] [CrossRef] [Google Scholar]
- Maraston, C. 2005, MNRAS, 362, 799 [NASA ADS] [CrossRef] [Google Scholar]
- Marconi, A., & Hunt, L. K. 2003, ApJ, 589, L21 [NASA ADS] [CrossRef] [Google Scholar]
- Matsuoka, K., Nagao, T., Marconi, A., Maiolino, R., & Taniguchi, Y. 2011, A&A, 527, A100 [NASA ADS] [CrossRef] [EDP Sciences] [Google Scholar]
- Matteucci, F. 1986, MNRAS, 221, 911 [NASA ADS] [Google Scholar]
- Matteucci, F., & Padovani, P. 1993, ApJ, 419, 485 [NASA ADS] [CrossRef] [Google Scholar]
- Merloni, A., Bongiorno, A., Bolzonella, M., et al. 2010, ApJ, 708, 137 [NASA ADS] [CrossRef] [Google Scholar]
- Michel-Dansac, L., Lambas, D. G., Alonso, M. S., & Tissera, P. 2008, MNRAS, 386, L82 [NASA ADS] [CrossRef] [Google Scholar]
- Montuori, M., Di Matteo, P., Lehnert, M. D., Combes, F., & Semelin, B. 2010, A&A, 518, A56 [NASA ADS] [CrossRef] [EDP Sciences] [Google Scholar]
- Moorwood, A., Cuby, J., & Lidman, C. 1998, The Messenger, 91, 9 [NASA ADS] [Google Scholar]
- Mortlock, D. J., Warren, S. J., Venemans, B. P., et al. 2011, Nature, 474, 616 [NASA ADS] [CrossRef] [PubMed] [Google Scholar]
- Mulchaey, J. S., Wilson, A. S., & Tsvetanov, Z. 1996, ApJ, 467, 197 [NASA ADS] [CrossRef] [Google Scholar]
- Nagao, T., Marconi, A., & Maiolino, R. 2006, A&A, 447, 157 [NASA ADS] [CrossRef] [EDP Sciences] [Google Scholar]
- Nelson, C. H. 2000, ApJ, 544, L91 [NASA ADS] [CrossRef] [Google Scholar]
- Nelson, C. H., & Whittle, M. 1996, ApJ, 465, 96 [NASA ADS] [CrossRef] [Google Scholar]
- Oke, J. B. 1974, ApJS, 27, 21 [NASA ADS] [CrossRef] [Google Scholar]
- Oke, J. B., & Sandage, A. 1968, ApJ, 154, 21 [NASA ADS] [CrossRef] [Google Scholar]
- Osterbrock, D. E., & Ferland, G. J. 2006, Astrophysics of gaseous nebulae and active galactic nuclei, 2nd edn., ed. D. E. Osterbrock, & G. J. Ferland (Sausalito, CA: University Science Books) [Google Scholar]
- Peng, C. Y., Ho, L. C., Impey, C. D., & Rix, H.-W. 2002, AJ, 124, 266 [NASA ADS] [CrossRef] [Google Scholar]
- Peng, C. Y., Impey, C. D., Rix, H.-W., et al. 2006, ApJ, 649, 616 [Google Scholar]
- Peng, C. Y., Ho, L. C., Impey, C. D., & Rix, H. 2010, AJ, 139, 2097 [NASA ADS] [CrossRef] [Google Scholar]
- Peterson, B. M., & Wandel, A. 2000, ApJ, 540, L13 [NASA ADS] [CrossRef] [Google Scholar]
- Peterson, B. M., Ferrarese, L., Gilbert, K. M., et al. 2004, ApJ, 613, 682 [NASA ADS] [CrossRef] [Google Scholar]
- Pettini, M., & Pagel, B. E. J. 2004, MNRAS, 348, L59 [NASA ADS] [CrossRef] [Google Scholar]
- Pettini, M., Zych, B. J., Steidel, C. C., & Chaffee, F. H. 2008, MNRAS, 385, 2011 [NASA ADS] [CrossRef] [Google Scholar]
- Pilyugin, L. S., & Thuan, T. X. 2005, ApJ, 631, 231 [NASA ADS] [CrossRef] [MathSciNet] [Google Scholar]
- Pilyugin, L. S., Thuan, T. X., & Vílchez, J. M. 2003, A&A, 397, 487 [NASA ADS] [CrossRef] [EDP Sciences] [Google Scholar]
- Ribaudo, J., Lehner, N., Howk, J. C., et al. 2011, ApJ, accepted [arXiv:1105.5381] [Google Scholar]
- Roth, M. M., Kelz, A., Fechner, T., et al. 2005, PASP, 117, 620 [NASA ADS] [CrossRef] [Google Scholar]
- Rupke, D. S. N., Kewley, L. J., & Chien, L. 2010, ApJ, 723, 1255 [NASA ADS] [CrossRef] [Google Scholar]
- Sánchez, S. F. 2006, AN, 327, 850 [Google Scholar]
- Sánchez, S. F., Jahnke, K., Wisotzki, L., et al. 2004, ApJ, 614, 586 [NASA ADS] [CrossRef] [Google Scholar]
- Sánchez, S. F., Aceituno, J., Thiele, U., Pérez-Ramírez, D., & Alves, J. 2007, PASP, 119, 1186 [NASA ADS] [CrossRef] [Google Scholar]
- Schawinski, K., Dowlin, N., Thomas, D., Urry, C. M., & Edmondson, E. 2010, ApJ, 714, L108 [NASA ADS] [CrossRef] [Google Scholar]
- Schlegel, D. J., Finkbeiner, D. P., & Davis, M. 1998, ApJ, 500, 525 [NASA ADS] [CrossRef] [Google Scholar]
- Schmitt, H. R., Donley, J. L., Antonucci, R. R. J., et al. 2003, ApJ, 597, 768 [NASA ADS] [CrossRef] [Google Scholar]
- Schneider, D. P., Richards, G. T., Hall, P. B., et al. 2010, AJ, 139, 2360 [NASA ADS] [CrossRef] [Google Scholar]
- Schramm, M., Wisotzki, L., & Jahnke, K. 2008, A&A, 478, 311 [NASA ADS] [CrossRef] [EDP Sciences] [Google Scholar]
- Schulze, A., & Wisotzki, L. 2010, A&A, 516, A87 [NASA ADS] [CrossRef] [EDP Sciences] [Google Scholar]
- Shemmer, O., Netzer, H., Maiolino, R., et al. 2004, ApJ, 614, 547 [NASA ADS] [CrossRef] [Google Scholar]
- Shen, S., Mo, H. J., White, S. D. M., et al. 2003, MNRAS, 343, 978 [NASA ADS] [CrossRef] [Google Scholar]
- Shen, B. S., Mo, H. J., White, S. D. M., et al. 2007, MNRAS, 379, 400 [NASA ADS] [CrossRef] [Google Scholar]
- Shields, G. A., Gebhardt, K., Salviander, S., et al. 2003, ApJ, 583, 124 [NASA ADS] [CrossRef] [Google Scholar]
- Sol Alonso, M., Michel-Dansac, L., & Lambas, D. G. 2010, A&A, 514, A57 [NASA ADS] [CrossRef] [EDP Sciences] [Google Scholar]
- Stockton, A., & MacKenty, J. W. 1987, ApJ, 316, 584 [NASA ADS] [CrossRef] [Google Scholar]
- Stockton, A., MacKenty, J. W., Hu, E. M., & Kim, T.-S. 2002, ApJ, 572, 735 [NASA ADS] [CrossRef] [Google Scholar]
- Stockton, A., Fu, H., Henry, J. P., & Canalizo, G. 2006, ApJ, 638, 635 [NASA ADS] [CrossRef] [Google Scholar]
- Storchi-Bergmann, T., Calzetti, D., & Kinney, A. L. 1994, ApJ, 429, 572 [NASA ADS] [CrossRef] [Google Scholar]
- Storchi-Bergmann, T., Schmitt, H. R., Calzetti, D., & Kinney, A. L. 1998, AJ, 115, 909 [NASA ADS] [CrossRef] [Google Scholar]
- Tadhunter, C. N., Scarrott, S. M., Draper, P., & Rolph, C. 1992, MNRAS, 256, 53P [NASA ADS] [CrossRef] [Google Scholar]
- Thuan, T. X., & Izotov, Y. I. 2005, ApJS, 161, 240 [NASA ADS] [CrossRef] [Google Scholar]
- Tremonti, C. A., Heckman, T. M., Kauffmann, G., et al. 2004, ApJ, 613, 898 [NASA ADS] [CrossRef] [Google Scholar]
- Treu, T., Woo, J., Malkan, M. A., & Blandford, R. D. 2007, ApJ, 667, 117 [NASA ADS] [CrossRef] [Google Scholar]
- Véron-Cetty, M., & Véron, P. 2010, A&A, 518, A10 [NASA ADS] [CrossRef] [EDP Sciences] [Google Scholar]
- Vestergaard, M. 2002, ApJ, 571, 733 [NASA ADS] [CrossRef] [Google Scholar]
- Vila Costas, M. B., & Edmunds, M. G. 1993, MNRAS, 265, 199 [NASA ADS] [CrossRef] [Google Scholar]
- Villar-Martín, M., Humphrey, A., Martínez-Sansigre, A., et al. 2008, MNRAS, 390, 218 [NASA ADS] [CrossRef] [Google Scholar]
- Villar-Martín, M., Tadhunter, C., Pérez, E., et al. 2010, MNRAS, 407, L6 [NASA ADS] [CrossRef] [Google Scholar]
- Warner, C., Hamann, F., & Dietrich, M. 2004, ApJ, 608, 136 [NASA ADS] [CrossRef] [Google Scholar]
- Warren, S. J., Hambly, N. C., Dye, S., et al. 2007, MNRAS, 375, 213 [NASA ADS] [CrossRef] [Google Scholar]
- Wisotzki, L., Christlieb, N., Bade, N., et al. 2000, A&A, 358, 77 [NASA ADS] [Google Scholar]
- Wright, E. L. 2006, PASP, 118, 1711 [NASA ADS] [CrossRef] [Google Scholar]
- York, D. G., Adelman, J., Anderson, Jr., J. E., et al. 2000, AJ, 120, 1579 [Google Scholar]
- Zakamska, N. L., Strauss, M. A., Krolik, J. H., et al. 2003, AJ, 126, 2125 [NASA ADS] [CrossRef] [Google Scholar]
- Zakamska, N. L., Strauss, M. A., Krolik, J. H., et al. 2006, AJ, 132, 1496 [NASA ADS] [CrossRef] [Google Scholar]
Appendix A: Estimation of the [N ii] detection limit in the spectra
The [N ii] λλ6548,6583 doublet could neither be detected in the QSO nor in the EELR spectra obtained for HE 2158 − 0107 with the PMAS spectrograph. Owing to the diagnostic importance of this line, we determined robust upper limits for those lines with the aid of dedicated Monte-Carlo simulations.
 |
Fig. A.1 Fraction of 3σ [N ii] detections among 200 simulated mock spectra as a function of simulated Hα/[N ii] ratio. The open squares correspond to simulated QSO spectra and the open triangles correspond to simulated EELR spectra. The dashed and solid lines highlight the 95% and 68% confidence limits corresponding to a 3σ and 1σ detection limit. |
Based on the best-fit Hα model for the QSO and EELR spectrum, we generated mock spectra including narrow [N ii] λλ6548,6583 lines, with the same profile and redshift as the narrow Hα line, within a certain range in Hα/[N ii]λ6583 ratios (Hα/[N ii] hereafter). We also added realistic Gaussian noise to the spectra including night-sky lines using the variance vector matched to the observed data. Two hundred mock spectra were generated for each Hα/[N ii] ratio.
In order to test for each mock spectrum whether the [N ii] lines could be recovered at a certain confidence level, we fitted the spectra with two different models, with and without the [N ii] components. The [N ii] lines add only one additional free parameter to the model, the [N ii]λ6583 flux, as the [N ii] λ6548/[N ii] λ6583 flux ratio is fixed to 1/3 and the line width and redshift were both coupled to the narrow Hα component. We employed the statistical F-test to check whether the model including the [N ii] is a significantly better model than the one without based on the χ2 values for a given simulated spectrum at a 95% confidence level.
In Fig. A.1 we present the fraction of spectra for which the model that includes a [N ii] component represented the data significantly better as a function of the input Hα/[N ii] line ratio. At high Hα/[N ii] ratios, the [N ii] is detected in 100% of the spectra. This fraction drops at a certain Hα/[N ii] ratio below 95% or 69%, which we adopted as our 3σ and σ detection limits, and smoothly decreases towards zero with decreasing Hα/[N ii] ratio, as expected. Our simulations imply a 3σ upper limit of Hα/ [N ii] < −0.8 for the EELR spectrum (Hα/ [N ii] < −0.8 1σ) and Hα/ [N ii] < −1.0 for the QSO spectrum (Hα/ [N ii] < −1.2 1σ), respectively.
Appendix B: Systematics of the QSO-host decomposition
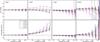 |
Fig. B.1 Results of Monte-Carlo simulations to estimate the systematic uncertainties of the 2D decomposition with GALFIT for HE 2158 − 0107. The upper panels present the difference in simulated and observed host magnitudes (Δmhost) as a function of the simulated host magnitude for five different effective radii assuming a de Vaucouleurs surface brightness profile. Detection limits (3σ) in host brightness for the different effective radii are indicated by the solid vertical lines in their corresponding colour. The lower panels show the ratio of the observed over the simulated effective radii as a function of the simulated host brightness. |
The 2D QSO-host decomposition is a complex process that is not free of systematic effects, especially in the high-contrast regime. Here we present Monte-Carlo simulation designed to investigate these systematic effects specifically for HE 2158−0107. We infer realistic errors for each band and obtain a robust upper limit for the host brightness in the H-band. We created a suite of mock images for each band with a fixed QSO magnitude corresponding to the observation. The surface brightness (SB) distribution of the underlying host galaxy was set to a de Vaucouleur law, the effective radii re were set to , , , or , and the host magnitudes varied within a reasonable range in steps of 0.3 mag. We produced 200 mock images for each set of parameters from the 2D grid in parameter space. The host orientations and the axis ratios (b/a) were randomly chosen where b/a was restricted to a range of 0.5–1.0. The simulated images were convolved with one of the available two PSF stars and the Gaussian noise pattern of the observed images was added before the images were analysed with GALFIT using the other PSF star.
The results of the Monte-Carlo simulations, shown in Fig. B.1, reveal that each band is subject to different systematic effects. Obviously, the r-band is the deepest image of the four with the highest S/N introducing no discernable systematics. For the i-band image we found that re increases strongly with the nucleus-to-host ratio, so that the re was significantly overestimated. We suspect that this could be caused by a PSF mismatch between the two PSFs for this band. The recovered re in the z and H-bands displays only little variation with host magnitude, but appears to be slightly offset from the true input value.
The uncorrected host magnitudes have substantial systematic errors that can only be determined with these simulations. Again the i-band exhibits the strongest deviations from the input values. In all cases, except for the r-band, we found that Δmhost is decreasing with increasing host brightness, which corresponds to a flux transfer from the PSF to the host component. The systematic offsets and errors matched to the observed parameters of the host in the r-, i-, and z-bands are Δmhost,r = 0.00 ± 0.02 mag, Δmhost,i = 0.08 ± 0.04 mag and Δmhost,z = −0.17 ± 0.11, respectively. The recovered host fluxes were significantly above the 3σ detection limit in all bands, except in the H-band. The 3σ detection limit for the host in this band critically depends on re and corresponds to mhost,H > 18.19 for .
All Tables
All Figures
|
Fig. 1 Integrated QSO spectrum of HE 2158−0107 as observed with the PMAS integral field spectrograph. All prominent emission lines are labelled and the four telluric absorption bands in the red part of the spectrum are marked. The red and yellow curves below the QSO spectrum represent the arbitrarily scaled r- and i-band transmission curves, respectively. The inset highlights the wavelength region of potentially strong stellar absorption lines. The redshifted spectrum of a 5 Gyr old SSP with solar metallicity (Bruzual & Charlot 2003) is overplotted as the red line in the inset for direct comparison and the main chemical species leading to the various absorption lines are labelled. |
| In the text | |
|
Fig. 2 Modelling of the broad Hβ (left panel) and Hα line (right panel). The red line represents the best-fit model to the data (black line) composed of individual Gaussians and a straight to approximate the local continuum. Individual Gaussian components for the Balmer lines are shown as blue lines above the continuum for a visual impression of their respective contribution. Two vertical dotted lines mark the wavelengths of the expected [N ii] λλ6548,6583 lines. The residuals of the best-fit model are displayed in the panels below. Some residuals of the bright Na iλ5893 night-sky line are visible above the broad Hβ line. Two telluric absorption bands of the Earth’s atmosphere are clearly visible at 7600–7700 Å and 8150–8350 Å. |
| In the text | |
|
Fig. 3 Standard BPT emission-line ratio diagram for HE 2158 − 0107. The measured line ratios of the NLR (filled red circle) and the EELR (opened red circle) are shown for the 3σ limits on log ( [N ii] /Hα) and the length of the arrows are such that their tip corresponds to the 1σ limit. The distribution of emission-line ratios for ~40 000 randomly selected SDSS galaxies are indicated by the grey scale for comparison. Triangle symbols indicate the NLR line ratio for a sample of AGN with low BH masses (Greene & Ho 2007) and blue opened squares represent four candidate low-metallicity AGN in dwarf galaxies as reported by Izotov & Thuan (2008) and Izotov et al. (2010). |
| In the text | |
|
Fig. 4 [O iii] light distribution and EELR spectrum for HE 2158 − 0107. Left panel: nucleus-subtracted 40 Å wide [O iii] narrow-band image as extracted from our PMAS datacube. The position of the QSO is highlighted by the white cross. A black box indicates the boundary for the extraction of a co-added spectrum. Right panel: co-added spectrum of the EELR region as defined in the left panel. The expected wavelengths of various emission-lines are indicated by the vertical dotted lines. |
| In the text | |
|
Fig. 5 Host galaxy images of HE 2158−0107 after 2D QSO-host decomposition with GALFIT. The first column represents the PSF (over)subtracted host images of the best-fit model including a point source only. The PSF subtracted host images and residuals of the best-fit model, including a point source and a de Vaucouleurs profile for the host, are shown in the second and third column, respectively. The radial surface brightness profiles of the data, best-fit model, and their components are presented in the fourth column to highlight the low contrast between nucleus and host. The orientation and position of the PMAS field of view with respect to the QSO is indicated by the black rectangle in the r-band image. A region covering the extended tail analysed in Sect. 4.5 is marked by the blue boundary. |
| In the text | |
|
Fig. 6 Host galaxy SED of HE 2158 − 0107 within a circular aperture of 3. Open and filled symbols correspond to the SED with and without the contribution of the emission lines in the r- and i-band. The best-fit 100 Myr SSP model (blue line) and composite 100 Myr+11 Gyr SSP model (red line) taken from the Bruzual & Charlot (2003) library of spectra are shown for comparison. |
| In the text | |
|
Fig. 7 Velocity field of the [O iii] EELR around HE 2158 − 0107. Left panel: radial velocity map inferred from the [O iii] emission line Doppler shift with respect to the rest-frame of the QSO. The black solid line represents roughly the apparent kinematic major axis. Right panel: radial velocity curves extracted from the velocity map along the kinematic major axis (black open circles). |
| In the text | |
|
Fig. 8 Left panel: MBH-Lbulge relation for the H-band. The black triangles are measurements from Marconi & Hunt (2003) for local galaxies and the dashed line is their best-fit relation. Our 3σ upper limit on LH,bulge for HE 2158 − 0107 is shown as the red open circle. Middle panel: MBH-Mbulge mass relation. The black squares correspond to the measurements of Häring & Rix (2004) with their best-fit relation shown as the dashed line. An SED based 3σ upper limit for the stellar mass of the HE 2158 − 0107 is indicated by the red open circle. An independent estimate based on the bulge size in the z-band using the size-mass relation by Shen et al. (2003) is shown as the blue open triangle. The light grey area represents the possible range in Mdyn of the bulge based on the ionised gas kinematics assuming rotational motion of a cold gas disc. Right panel: MBH-σ∗ relation for local galaxies with dynamical MBH measurements. Measurements by Gültekin et al. (2009) are shown as black round symbols and the dashed line indicates their best-fit relation. We used the line dispersion of the [O iii] line (green open square) in the unresolved NLR of HE 2158 − 0107 as a surrogate for σ∗, following the suggestion by Nelson (2000). |
| In the text | |
|
Fig. 9 Gas-phase oxygen abundance against total stellar mass. The grey-scale image corresponds to a 2D histogram as constructed by Tremonti et al. (2004) from the SDSS MPA/JHU galaxy catalogues. The red solid line represents the corresponding best-fit mass-metallicity relation for which the dashed lines indicate roughly its 3σ uncertainty. Most of the AGN hosts among the sample of Greene & Ho (2007) are within or slightly below this mass-metallicity relation. The blue open triangle and the red open circle highlight the exceptionally low metallicity of HE 2158 − 0107 with respect to the mass-metallicity relation, for which the stellar mass was estimated from the bulge size and the host SED, respectively. |
| In the text | |
|
Fig. 10 SED of the extended tail close to HE 2158 − 0107. The surface brightness of a certain region centre on the extended tail (cf. Fig. 5) is shown at the effective wavelength of the corresponding passband. The initial surface brightnesses are indicated as open symbols, whereas the filled symbols denote the surface brightness after subtraction of the emission-line contribution. |
| In the text | |
|
Fig. A.1 Fraction of 3σ [N ii] detections among 200 simulated mock spectra as a function of simulated Hα/[N ii] ratio. The open squares correspond to simulated QSO spectra and the open triangles correspond to simulated EELR spectra. The dashed and solid lines highlight the 95% and 68% confidence limits corresponding to a 3σ and 1σ detection limit. |
| In the text | |
|
Fig. B.1 Results of Monte-Carlo simulations to estimate the systematic uncertainties of the 2D decomposition with GALFIT for HE 2158 − 0107. The upper panels present the difference in simulated and observed host magnitudes (Δmhost) as a function of the simulated host magnitude for five different effective radii assuming a de Vaucouleurs surface brightness profile. Detection limits (3σ) in host brightness for the different effective radii are indicated by the solid vertical lines in their corresponding colour. The lower panels show the ratio of the observed over the simulated effective radii as a function of the simulated host brightness. |
| In the text | |
Current usage metrics show cumulative count of Article Views (full-text article views including HTML views, PDF and ePub downloads, according to the available data) and Abstracts Views on Vision4Press platform.
Data correspond to usage on the plateform after 2015. The current usage metrics is available 48-96 hours after online publication and is updated daily on week days.
Initial download of the metrics may take a while.