Fig. 10
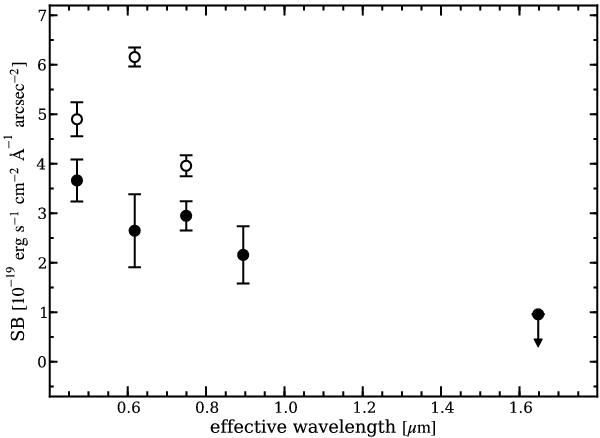
SED of the extended tail close to HE 2158 − 0107. The surface brightness of a certain region centre on the extended tail (cf. Fig. 5) is shown at the effective wavelength of the corresponding passband. The initial surface brightnesses are indicated as open symbols, whereas the filled symbols denote the surface brightness after subtraction of the emission-line contribution.
Current usage metrics show cumulative count of Article Views (full-text article views including HTML views, PDF and ePub downloads, according to the available data) and Abstracts Views on Vision4Press platform.
Data correspond to usage on the plateform after 2015. The current usage metrics is available 48-96 hours after online publication and is updated daily on week days.
Initial download of the metrics may take a while.