Fig. 2
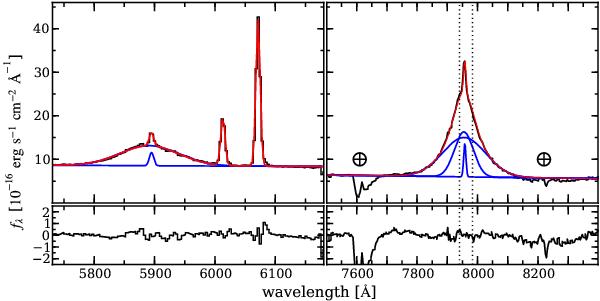
Modelling of the broad Hβ (left panel) and Hα line (right panel). The red line represents the best-fit model to the data (black line) composed of individual Gaussians and a straight to approximate the local continuum. Individual Gaussian components for the Balmer lines are shown as blue lines above the continuum for a visual impression of their respective contribution. Two vertical dotted lines mark the wavelengths of the expected [N ii] λλ6548,6583 lines. The residuals of the best-fit model are displayed in the panels below. Some residuals of the bright Na iλ5893 night-sky line are visible above the broad Hβ line. Two telluric absorption bands of the Earth’s atmosphere are clearly visible at 7600–7700 Å and 8150–8350 Å.
Current usage metrics show cumulative count of Article Views (full-text article views including HTML views, PDF and ePub downloads, according to the available data) and Abstracts Views on Vision4Press platform.
Data correspond to usage on the plateform after 2015. The current usage metrics is available 48-96 hours after online publication and is updated daily on week days.
Initial download of the metrics may take a while.