Fig. 3
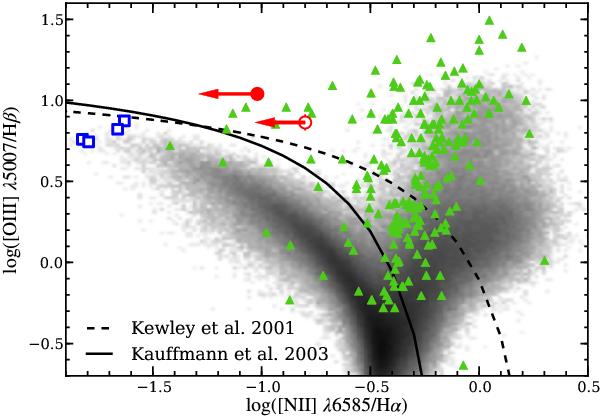
Standard BPT emission-line ratio diagram for HE 2158 − 0107. The measured line ratios of the NLR (filled red circle) and the EELR (opened red circle) are shown for the 3σ limits on log ( [N ii] /Hα) and the length of the arrows are such that their tip corresponds to the 1σ limit. The distribution of emission-line ratios for ~40 000 randomly selected SDSS galaxies are indicated by the grey scale for comparison. Triangle symbols indicate the NLR line ratio for a sample of AGN with low BH masses (Greene & Ho 2007) and blue opened squares represent four candidate low-metallicity AGN in dwarf galaxies as reported by Izotov & Thuan (2008) and Izotov et al. (2010).
Current usage metrics show cumulative count of Article Views (full-text article views including HTML views, PDF and ePub downloads, according to the available data) and Abstracts Views on Vision4Press platform.
Data correspond to usage on the plateform after 2015. The current usage metrics is available 48-96 hours after online publication and is updated daily on week days.
Initial download of the metrics may take a while.