Fig. 4
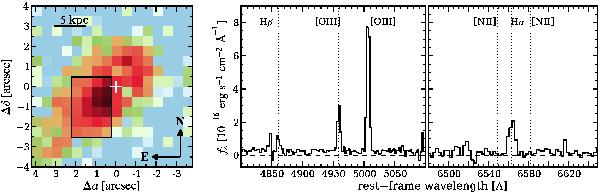
[O iii] light distribution and EELR spectrum for HE 2158 − 0107. Left panel: nucleus-subtracted 40 Å wide [O iii] narrow-band image as extracted from our PMAS datacube. The position of the QSO is highlighted by the white cross. A black box indicates the boundary for the extraction of a co-added spectrum. Right panel: co-added spectrum of the EELR region as defined in the left panel. The expected wavelengths of various emission-lines are indicated by the vertical dotted lines.
Current usage metrics show cumulative count of Article Views (full-text article views including HTML views, PDF and ePub downloads, according to the available data) and Abstracts Views on Vision4Press platform.
Data correspond to usage on the plateform after 2015. The current usage metrics is available 48-96 hours after online publication and is updated daily on week days.
Initial download of the metrics may take a while.