Fig. 5
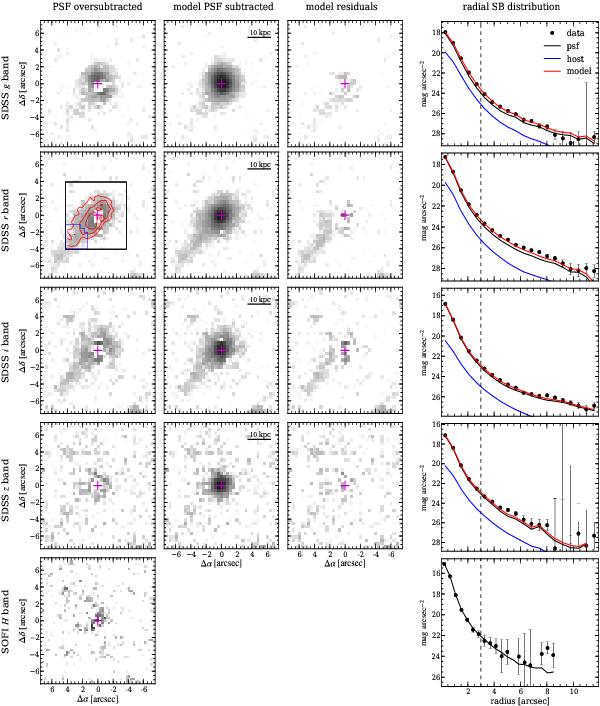
Host galaxy images of HE 2158−0107 after 2D QSO-host decomposition with GALFIT. The first column represents the PSF (over)subtracted host images of the best-fit model including a point source only. The PSF subtracted host images and residuals of the best-fit model, including a point source and a de Vaucouleurs profile for the host, are shown in the second and third column, respectively. The radial surface brightness profiles of the data, best-fit model, and their components are presented in the fourth column to highlight the low contrast between nucleus and host. The orientation and position of the PMAS field of view with respect to the QSO is indicated by the black rectangle in the r-band image. A region covering the extended tail analysed in Sect. 4.5 is marked by the blue boundary.
Current usage metrics show cumulative count of Article Views (full-text article views including HTML views, PDF and ePub downloads, according to the available data) and Abstracts Views on Vision4Press platform.
Data correspond to usage on the plateform after 2015. The current usage metrics is available 48-96 hours after online publication and is updated daily on week days.
Initial download of the metrics may take a while.