Fig. 8
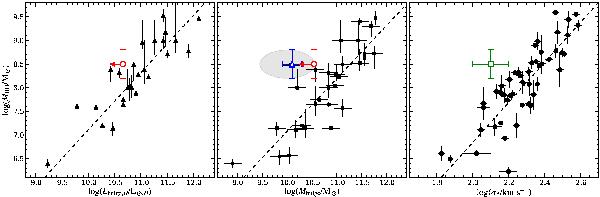
Left panel: MBH-Lbulge relation for the H-band. The black triangles are measurements from Marconi & Hunt (2003) for local galaxies and the dashed line is their best-fit relation. Our 3σ upper limit on LH,bulge for HE 2158 − 0107 is shown as the red open circle. Middle panel: MBH-Mbulge mass relation. The black squares correspond to the measurements of Häring & Rix (2004) with their best-fit relation shown as the dashed line. An SED based 3σ upper limit for the stellar mass of the HE 2158 − 0107 is indicated by the red open circle. An independent estimate based on the bulge size in the z-band using the size-mass relation by Shen et al. (2003) is shown as the blue open triangle. The light grey area represents the possible range in Mdyn of the bulge based on the ionised gas kinematics assuming rotational motion of a cold gas disc. Right panel: MBH-σ∗ relation for local galaxies with dynamical MBH measurements. Measurements by Gültekin et al. (2009) are shown as black round symbols and the dashed line indicates their best-fit relation. We used the line dispersion of the [O iii] line (green open square) in the unresolved NLR of HE 2158 − 0107 as a surrogate for σ∗, following the suggestion by Nelson (2000).
Current usage metrics show cumulative count of Article Views (full-text article views including HTML views, PDF and ePub downloads, according to the available data) and Abstracts Views on Vision4Press platform.
Data correspond to usage on the plateform after 2015. The current usage metrics is available 48-96 hours after online publication and is updated daily on week days.
Initial download of the metrics may take a while.