Fig. 3
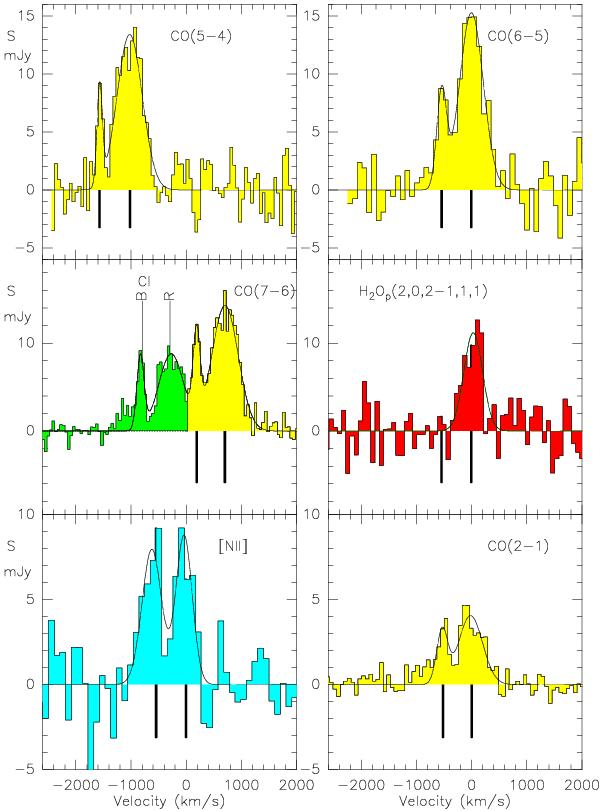
Four CO lines, with the C I , H2Op(2,0,2 − 1,1,1) and [NII] lines. All spectra are from the IRAM-30 m, except for the CI/CO(7–6) from the PdBI, and CO(2–1) from EVLA. Upper vertical lines indicate the red (R) or blue (B) components for CI, and lower vertical lines indicate the same for all others. All panels have the same velocity scale (translated for CO(5–4) and CO/CI). The blue component of the [NII] line is much stronger and broader than for the CO lines, suggesting a strong ionized gas flow. Exact velocities are detailed in Table 2.
Current usage metrics show cumulative count of Article Views (full-text article views including HTML views, PDF and ePub downloads, according to the available data) and Abstracts Views on Vision4Press platform.
Data correspond to usage on the plateform after 2015. The current usage metrics is available 48-96 hours after online publication and is updated daily on week days.
Initial download of the metrics may take a while.