Fig. 6
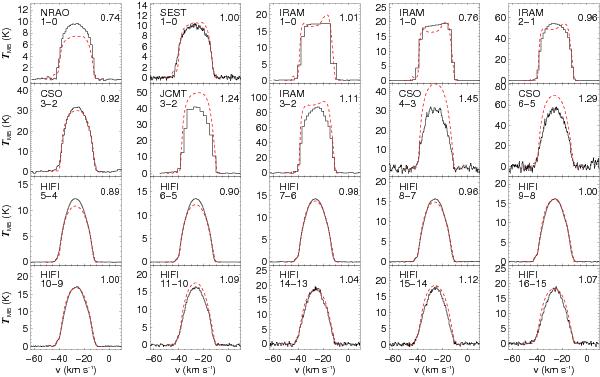
Comparison of the observed 12CO emission lines (black histogram), and the line profiles predicted by the GASTRoNOoM-model (red dashed line) with parameters as listed in Table 5. The line transitions J − (J − 1) and the telescopes with which they were observed are indicated in the upper left corner of every panel. The factor IMB,model/IMB,data is given in the upper right corner of every panel.
Current usage metrics show cumulative count of Article Views (full-text article views including HTML views, PDF and ePub downloads, according to the available data) and Abstracts Views on Vision4Press platform.
Data correspond to usage on the plateform after 2015. The current usage metrics is available 48-96 hours after online publication and is updated daily on week days.
Initial download of the metrics may take a while.