Fig. 3
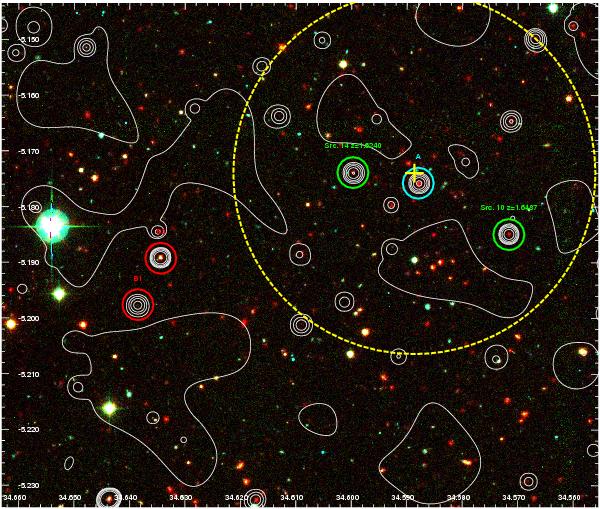
Chandra contours in the [0.5–2] keV band, overlaid on a g − r − 3.6 μm image of the cluster. The contours result from the filtering of Fig. 1 by a wavelet adapted to low-count statistics (Starck & Pierre 1998): the image is de-noised but intensity is not strictly conserved. The first contour is indicative of the background level. The two green circles indicate the X-ray sources for which a spectroscopic redshift is available, in addition to source A (see Table 1). The red circles highlight the B sources. The yellow-dashed circle has a radius of 1 Mpc at the cluster redshift. The yellow cross indicates the center of the IRAC overdensity (Papovich et al. 2010).
Current usage metrics show cumulative count of Article Views (full-text article views including HTML views, PDF and ePub downloads, according to the available data) and Abstracts Views on Vision4Press platform.
Data correspond to usage on the plateform after 2015. The current usage metrics is available 48-96 hours after online publication and is updated daily on week days.
Initial download of the metrics may take a while.