Fig. 1
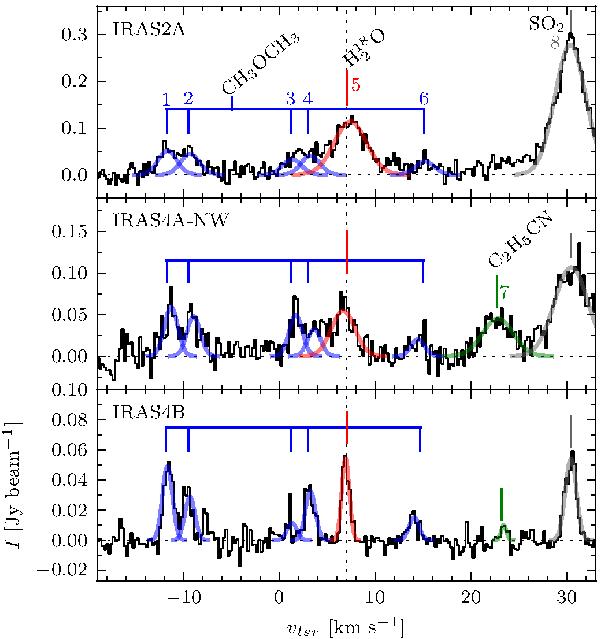
Spectra extracted in a pixel toward the continuum peak positions for IRAS2A, IRAS4A-NW and IRAS4B. The identified lines are marked, including the targeted H O 31,3 − 22,0 line. Parameters from the fits are tabulated in Table A.2. The numbers above the lines and the colors correspond to the numbers (emission lines) and colors in Fig. 3, Tables 3, A.1 and A.2. The spectra have been binned to a width of 0.23 km s-1 (i.e., 2 channels per bin), and Gaussian profiles have been fitted to the identified lines. The systemic velocity of the HO line is marked by the vertical dotted line at vlsr = 7.0 km s-1. Note the difference in scale of the y-axis for the spectra.
Current usage metrics show cumulative count of Article Views (full-text article views including HTML views, PDF and ePub downloads, according to the available data) and Abstracts Views on Vision4Press platform.
Data correspond to usage on the plateform after 2015. The current usage metrics is available 48-96 hours after online publication and is updated daily on week days.
Initial download of the metrics may take a while.