Fig. 10
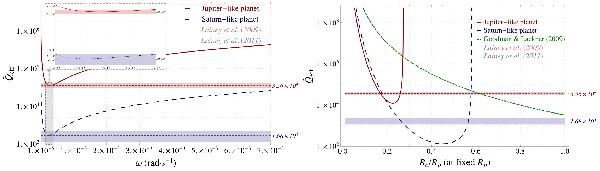
Dissipation quality factor  normalized to the size of the planet for Jupiter-like and Saturn-like giant
planets. Note that all curves are represented on a logarithmic scale.
Left: dependence on the perturbative strain pulsation
ω, with
Rc = { 0.17,0.26 } × Rp.
Right: dependence on the size of the core, with
ω ≃ 2.25 × 10⁻⁴ rad s-1 (tidal
frequency of Enceladus) for the blue curve associated with a Saturn-like planet,
and ω ≃ 2.79 × 10⁻⁴ rad s-1 (tidal
frequency of Io) for the red curve associated with a Jupiter-like planet. The
green curve corresponds to the prescription of Goodman & Lackner (2009)
(see plain text for details). The red and blue dashed lines correspond to the
value of
normalized to the size of the planet for Jupiter-like and Saturn-like giant
planets. Note that all curves are represented on a logarithmic scale.
Left: dependence on the perturbative strain pulsation
ω, with
Rc = { 0.17,0.26 } × Rp.
Right: dependence on the size of the core, with
ω ≃ 2.25 × 10⁻⁴ rad s-1 (tidal
frequency of Enceladus) for the blue curve associated with a Saturn-like planet,
and ω ≃ 2.79 × 10⁻⁴ rad s-1 (tidal
frequency of Io) for the red curve associated with a Jupiter-like planet. The
green curve corresponds to the prescription of Goodman & Lackner (2009)
(see plain text for details). The red and blue dashed lines correspond to the
value of  (for Jupiter and Saturn, respectively) determined by Lainey et al. (2009–2012).
Their zone of uncertainty is also represented by the corresponding color. We
assume the values of
Rp = { 10.97,9.14 } (in units of
(for Jupiter and Saturn, respectively) determined by Lainey et al. (2009–2012).
Their zone of uncertainty is also represented by the corresponding color. We
assume the values of
Rp = { 10.97,9.14 } (in units of
 ),
Mp = { 317.8,95.16 } (in units of
),
Mp = { 317.8,95.16 } (in units of
 ), and
 given in Tables 5, 6. We also assume the viscoelastic parameters, for Jupiter and
Saturn respectively,
G = { 4.85,4.45 } × 1010 (Pa),
and
η = { 1.26,1.78 } × 1014 (Pa s).
given in Tables 5, 6. We also assume the viscoelastic parameters, for Jupiter and
Saturn respectively,
G = { 4.85,4.45 } × 1010 (Pa),
and
η = { 1.26,1.78 } × 1014 (Pa s).
Current usage metrics show cumulative count of Article Views (full-text article views including HTML views, PDF and ePub downloads, according to the available data) and Abstracts Views on Vision4Press platform.
Data correspond to usage on the plateform after 2015. The current usage metrics is available 48-96 hours after online publication and is updated daily on week days.
Initial download of the metrics may take a while.