Fig. 5
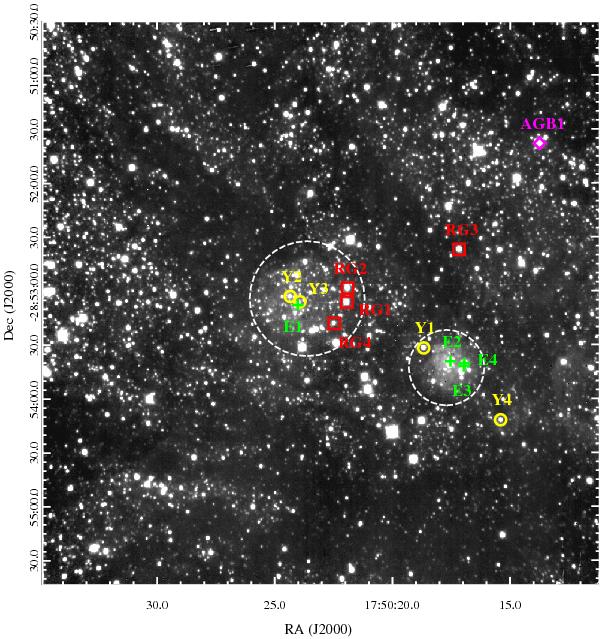
KS band image of CN15/16/17. Markers show the positions of the stars with spectral classifications. Green crosses are early type stars, yellow circles are candidate YSOs, red squares are red giants, and the magenta diamond is an AGB star. IDs correspond to the first column of Table 2. The two white dashed circular regions are the areas corresponding to clusters DB10 (lower right, 21″ in radius, i.e. 0.12 pc at 1200 pc distance) and DB11 (center, 32″ in radius, i.e. 0.18 pc at 1200 pc distance).
Current usage metrics show cumulative count of Article Views (full-text article views including HTML views, PDF and ePub downloads, according to the available data) and Abstracts Views on Vision4Press platform.
Data correspond to usage on the plateform after 2015. The current usage metrics is available 48-96 hours after online publication and is updated daily on week days.
Initial download of the metrics may take a while.