Fig. 3
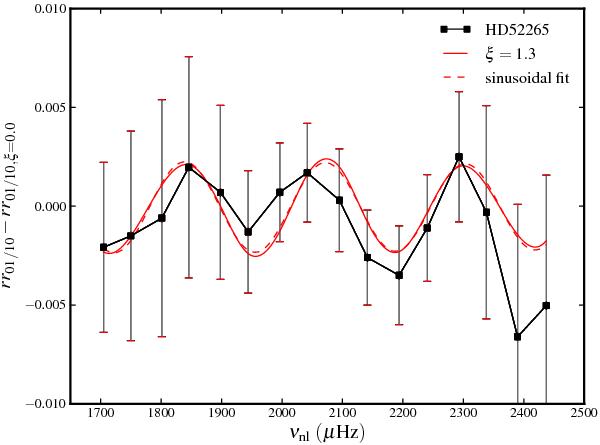
Difference of the ratios rr01/10(n) as a function of frequency between the standard model (no PC, ξ = 0.0) and (i) the model with PC with an extent of ξ = 1.3 (red continuous line), (ii) the observations (black). The dashed red line is a sinusoidal fit of the red curve (see text). Note that to calculate the differences, models were splined on the observed frequency grid. A detailed comparison with observations is provided in Fig. 4.
Current usage metrics show cumulative count of Article Views (full-text article views including HTML views, PDF and ePub downloads, according to the available data) and Abstracts Views on Vision4Press platform.
Data correspond to usage on the plateform after 2015. The current usage metrics is available 48-96 hours after online publication and is updated daily on week days.
Initial download of the metrics may take a while.