| Issue |
A&A
Volume 544, August 2012
|
|
|---|---|---|
| Article Number | L13 | |
| Number of page(s) | 4 | |
| Section | Letters | |
| DOI | https://doi.org/10.1051/0004-6361/201220000 | |
| Published online | 09 August 2012 | |
Seismic signature of envelope penetrative convection: the CoRoT star HD 52265
1 Observatoire de Paris, GEPI, CNRS UMR 8111, 92195 Meudon, France
2 Institut de Physique de Rennes, Université de Rennes 1, CNRS UMR 6251, 35042 Rennes, France
e-mail: This email address is being protected from spambots. You need JavaScript enabled to view it.
3 Observatoire de Paris, LESIA, CNRS UMR 8109, 92195 Meudon, France
Received: 12 July 2012
Accepted: 27 July 2012
Abstract
Aims. We aim at characterizing the inward transition from convective to radiative energy transport at the base of the convective envelope of the solar-like oscillator HD 52265 recently observed by the CoRoT satellite.
Methods. We investigated the origin of one specific feature found in the HD 52265 frequency spectrum. We modelled the star to derive the internal structure and the oscillation frequencies that best match the observations and used a seismic indicator sensitive to the properties of the base of the envelope convection zone.
Results. The seismic indicators clearly reveal that to best represent the observed properties of HD 52265, models must include penetrative convection below the outer convective envelope. The penetrative distance is estimated to be ~0.95HP, which corresponds to an extent over a distance representing 6.0 per cents of the total stellar radius, significantly larger than what is found for the Sun. The inner boundary of the extra-mixing region is found at 0.800 ± 0.004 R where R = 1.3 R⊙ is the stellar radius.
Conclusions. These results contribute to the tachocline characterization in stars other than the Sun.
Key words: asteroseismology / stars: interiors / stars: oscillations / stars: individual: HD 52265
© ESO, 2012
1. Introduction
Low-mass main-sequence (MS) stars have convective envelopes in which the chemical elements are mixed on short time scales and – at least in the deeper parts of the envelope – the energy transport by fluid elements can be treated as an adiabatic process. In the standard description, convective zones (CZ) are regions where the Schwarzschild criterion is fulfilled. Their boundaries lie at the border where the adiabatic temperature gradient equals the radiative one. It is expected, however, that fluid elements penetrate into the adjacent radiative zone due to their inertia (see e.g. Zahn 1991). In the Sun, the transition region (tachocline) is believed to be the site where the dynamo originates.
Penetrative convection (PC) corresponds to efficient convective heat transport – and material mixing – by downward flows that establish a close to adiabatic temperature stratification below which the downward plumes are no longer able to modify the temperature stratification that remains close to radiative. The extent of PC and/or overshoot in stars cannot be derived from first principles and is still largely unknown.
A crucial point therefore is to find observational signatures of PC in low-mass MS stars. This can be achieved by means of asteroseismology. The abrupt change of energy transport from a convective to a radiative regime is visible in the sound speed profile and impacts the oscillations frequencies as well as some characteristic frequency spacings, which then show an oscillatory (periodic) behaviour (Gough 1990; Roxburgh & Vorontsov 1994). Owing to the importance of the tachocline region, helioseismic studies have attempted to measure the extent of the PC in the Sun (Berthomieu et al. 1993; Monteiro et al. 1994). Christensen-Dalsgaard et al. (2011) have recently found that convective envelope overshoot is necessary over an estimated extent of 0.37HP (HP is the pressure scale height). The high-quality solar data and wide available range of values of mode degrees ℓ allowed Christensen-Dalsgaard et al. to also show that the transition between the convective and the radiative stratification must be smooth, intermediate between a classical – ballistic – overshoot formulation and a no-overshoot one.
Solar-like oscillations have been identified in many stars first from the ground, then from space by the CoRoT (Baglin et al. 2002) and Kepler (Koch et al. 2010) high-precision photometry missions, leading to an accuracy in frequency measurements of a few tenths μHz. Theoretical studies of the effects on the oscillations frequencies of PC at the base of a CZ have been conducted using low-degree modes, the only ones expected to be detectable in stars (see e.g. Roxburgh 2009,and references therein). The period of the oscillatory component is found to be related to the location of the discontinuity inside the star and its amplitude to depend on the height of the discontinuity. One then expects that the amplitude of the oscillatory signal grows with an increasing extent of PC that causes a larger jump from the adiabatic temperature gradient to the radiative one below. Moreover, for a larger PC extent, the discontinuity is located deeper inside the star and the period of the oscillation is expected to be longer (Roxburgh 1993).
Ballot et al. (2011) analysed the CoRoT oscillation spectrum of the star HD 52265 (HIP 33719), a high-metallicity G0V star hosting an exoplanet. They found a typical p-mode solar-like spectrum, and identified 28 reliable low-degree p-modes of degrees ℓ = 0, 1, 2 and order n in the range 14–24 (see their Table 4). The frequencies νn,ℓ are in the range 1500–2550 μHz with a frequency at maximum amplitude νmax = 2090 ± 20 μHz. The error on each frequency is a few tenths of μHz. Such a high quality data set enables to probe the interior structure of the star. Here we report on one evidence for PC below the upper convective region of HD 52265 as indicated by its internal structure modelling.
2. HD 52265: observations and modelling
2.1. Global and seismic observational constraints
To model HD 52265 we adopted the effective temperature Teff = 6120 ± 110 K and metallicity [Fe/H] = 0.22 ± 0.05 dex that we derived from an average of 20 spectroscopic determinations reported since 2001. We adopted the luminosity L = 2.053 ± 0.053 L⊙ that we derived from the Hipparcos parallax (van Leeuwen 2007), Tycho magnitude and bolometric correction calculated according to VandenBerg & Clem (2003). We related the ratio of heavy elements mass fraction Z to hydrogen mass fraction X to [Fe/H] through [Fe/H] = log (Z/X) − log (Z/X)⊙ and adopt (Z/X)⊙ = 0.0244 from the Grevesse & Noels (1993) solar mixture.
In the following we will focus on the ability of models to reproduce the values of the seismic indicators rr01(n) and rr10(n) introduced by Roxburgh & Vorontsov (2003), which are defined as  (1)where
 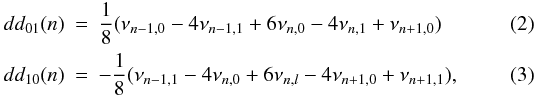 where Δνℓ(n) = νn + 1,ℓ − νn,ℓ are the standard large frequency separations (Tassoul 1980). Roxburgh & Vorontsov showed that the ratios rr01 and rr10 (hereafter rr01/10) are sensitive to the sharp variation of the sound speed in the transition region between the upper CZ and the radiative layers beneath (see also Otí Floranes et al. 2005). Roxburgh (2009), using high-quality solar data, confirmed that these indicators exhibit an oscillatory behaviour as a function of the frequency. From the 28 reliable individual frequencies determined by Ballot et al. (2011), we calculated the rr01/10(n) ratios. The variations of rr01(n) (resp. rr10(n)) as a function of frequency νn,0 (resp. νn,1) are plotted in Fig. 1. Ballot et al. already noticed a periodic variation of the separations d01(n) = ν0,n − 1 − 0.5(ν1,n + ν1,n − 1) and d10(n) = −ν1,n + 0.5(ν0,n + ν0,n + 1) and suggested that it could be the signature of the CZ boundary. The periodic variation is even clearer in the rr01/10(n) separation, and Sect. 3 is devoted to confirming the origin of this periodic signal and to characterizing it.
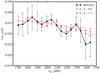 |
Fig. 1 Observed ratios rr01/10(n) (black squares) as a function of frequency νn,0/n,1 for HD 52265 compared to the rr01/10(n) ratios in the models without PC (ξ = 0.0, magenta) and with PC (ξ = 1.3, red). |
2.2. Internal structure models and their oscillations
We modelled HD 52265 with the evolution code Cesam2k (Morel & Lebreton 2008) and the input physics and parameters described in Lebreton (2011). We considered the model for PC below the convective envelope proposed by Zahn (1991). In this model the distance of fluid penetration into the radiative zone reads Lp = (ξ/χP)HP, where χP = (∂log χ/∂log P)ad is the adiabatic derivative with respect to pressure P of the radiative conductivity χ = 16σT3/(3ρκ) (T,ρ,κ,σ are the temperature, density, opacity, and Boltzmann constant, respectively). The free parameter ξ is of the order of unity but has to be calibrated by comparing stellar models to observations. The seismic indicators rr01/10 that we considered here are sensitive to the change in the temperature derivative hence to the transition from an unstable to a stable stratification. The amplitude of the periodic signal is smaller for a smoother transition and cannot be detected if the transition is highly smooth. We therefore concentrated on determining the adiabatic extent of the overshoot region. We accordingly imposed that the temperature gradient in the overshooting zone is the adiabatic gradient.
Equilibrium models were calculated and adjusted to satisfy the constraints provided by the global parameters (L,Teff and surface [Fe/H] ) and the 28 reliable observed frequencies of Ballot et al. (2011). The model frequencies were calculated with the LOSC adiabatic oscillation code (Scuflaire et al. 2008) for the whole range of observed mode orders and degrees, and the observed and modelled seismic indicators were derived consistently. We corrected the model frequencies from the so-called near surface effects using the empirical correction proposed by Kjeldsen et al. (2008). The frequency differences may be sensitive to surface effects, however, we recall that Roxburgh & Vorontsov (2003) demonstrated that the ratios of small to large separations are quite independent of the surface treatment and are therefore efficient probes of the interior.
We used the Levenberg-Marquardt minimization method as described in Miglio & Montalbán (2005) to adjust the age and mass, the initial helium and metallicity, the mixing-length parameter for convection, the convective core overshooting extent, and surface effects parameter so that the model of HD 52265 fits the observations best, within the error bars. The goodness of fit was evaluated through minimization of the reduced χ2:  , where Nobs is the number of observational constraints considered, xi,mod and xi,obs are the modelled and observed values of the ith parameter, respectively, and σi,obs is the error on xi,obs. We point out that the convective core overshooting extent derived from preliminary model calibrations of HD 52265 is low, lower than 0.10Hp. Because the properties of the central region do not affect the effect we study at the transition region, the models presented here do not include core overshooting. The detailed properties of the models will be presented in a forthcoming paper.
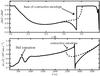 |
Fig. 2 Top: temperature gradient as a function of radius in a model with penetrative convection (continuous line) and a standard model (dashed line) of HD 52265. Bottom: sound speed gradient with respect to the acoustic depth |
3. Extent of penetrative convection
The best-fit models yield total χ2-values in the range 2–3 whatever the value of the PC and therefore cannot be distinguished on that basis. The models have an age A ≃ 2 Gyr, a mass M ≃ 1.25 M⊙ and a radius R ≃ 1.3 R⊙ in quite reasonable agreement with the values derived by Escobar et al. (2012) in their recent modelling of the star. We now examine the impact of PC on the rr01/10(n) frequency ratios.
We first compared models with ξ = 0.0 and 1.3. The variations of the ratios rr01/10(n) with frequency are shown in Fig. 1. The amplitude of the oscillatory component is significantly smaller for ξ = 0.0 than for ξ = 1.3. The impact of a nonvanishing ξ on the structure of the model with ξ = 1.3 compared with a model without PC is illustrated in Fig. 2. Differences appear in the transition region below the convection zone while everywhere else, the structures coincide. The top of Fig. 2 shows the behaviour of the temperature gradient below the CZ in the model of HD 52265. Without PC the CZ is located at rSc, the Schwarzschild radius. The temperature gradient drops from its adiabatic value 0.4 at the border of the convective envelope and takes the value of the radiative gradient. In contrast, when PC takes place below rSc as in model with ξ = 1.3, a discontinuity in the temperature gradient occurs at the bottom of the mixed region (including the PC extent), resulting in a nearby density discontinuity. This sharpens the variation of the adiabatic sound speed cs = (Γ1P/ρ)1/2 at the base of the convective envelope in models including PC (Γ1 is the first adiabatic index). The bottom of Fig. 2 shows the sound speed gradient as a function of the acoustic depth  . Rapid variations in the sound speed gradient can be seen, which correspond to the HeI ionization (τ ~ 620 s) and to the inner limit of the external CZ. At the base of the CZ, the variation of dcs/dτ for the model including PC behaves as a near discontinuity (τ ~ 2780 s), whereas is remains continuous in the standard model where only d2cs/dτ2 is marginally discontinuous (τ ~ 2450 s).
To examine the ability of models to reproduce the observed rr01/10 oscillatory trend, the difference between the signals from the observations and models was measured with a specific χ2 quantity where the variables are xi = rr01/10(n). Considering models with increasing ξ, we found that the variation of χ2 shows a minimum between ξ = 1.2 and 1.3. The signals from models with ξ ≤ 1.1 or ξ ≥ 1.4 lead to significantly larger χ2, excluding these models as acceptable. We therefore found a PC extent of ξ ≃ 1.25 ± 0.10 for HD 52265. This translates into an overshoot distance of dov = 0.95 ± 0.08 Hp corresponding to dov = 0.060 ± 0.004 R.
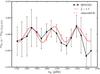 |
Fig. 3 Difference of the ratios rr01/10(n) as a function of frequency between the standard model (no PC, ξ = 0.0) and (i) the model with PC with an extent of ξ = 1.3 (red continuous line), (ii) the observations (black). The dashed red line is a sinusoidal fit of the red curve (see text). Note that to calculate the differences, models were splined on the observed frequency grid. A detailed comparison with observations is provided in Fig. 4. |
4. Seismic location of the base of the adiabatic temperature stratification
The structure of inner regions below the transition layer is unaffected by a change in ξ. It is therefore reasonable to assume that the long-term trend seen in Fig. 1 for both signals with and without PC is the same and has its origin deeper in the star. This enables us to remove it to isolate the oscillatory component arising from the base of the CZ of model with ξ = 1.3. We interpolated the rr01/10(n) signals of the models with ξ = 0.0 and 1.3 on the same frequency grid and computed their differences. The differences plotted in Fig. 3 are clearly generated by including PC in the model with ξ = 1.3. We obtain an almost pure sinusoid, the characteristics of which can be estimated and related to the properties of the region of PC. Slightly different expressions of the sinusoidal component arising from the CZ base that is expected to be visible in several seismic indicators of distant stars have been established theoretically (see e.g. Roxburgh & Vorontsov 1994; Monteiro et al. 2000; Basu et al. 2004; Mazumdar 2005; Verner et al. 2006; Houdek & Gough 2007; Roxburgh 2009). Guided by them, we assumed that the model oscillation in Fig. 3, which stems from the difference Δrr01/10(n) = rr01/10(n)ξ = 1.3 − rr01/10(n)ξ = 0.0, can take two nearly equivalent forms expressed in the caption of Table 1. Roxburgh (2009) expressed the periodicity of the signal as 1/(2Tξ = 1.3), which provides the acoustic radius Tξ = 1.3 = τt − τ(r) at the base of the CZ. τ(r) is the acoustic depth and τt ≡ τ(r = 0) = 1/(2 ⟨ Δν ⟩ ), where ⟨ Δν ⟩ is the mean asymptotic large frequency separation. The amplitude is a slowly varying function of ν with a term in ν-1 (resp. ν-2), arising from a discontinuity in the first (resp. second) derivative of the sound speed. We list in Table 1 the values of Tξ = 1.3 and other parameters of the fit of the sinusoidal signal of Fig. 3 ( ). The results weakly depend on the assumed form for Δrr01/10(n). We find Tξ = 1.3 ≃ 2167 ± 15 s, which is higher than values obtained by Monteiro et al. (2000) because Monteiro et al. considered less overshoot and slightly smaller stellar masses. These Tξ = 1.3 values can now be compared with the theoretical value, Tov = τt − τ(rov), directly computed from the equilibrium model with ξ = 1.3, where rov is the radius at the base of the adiabatic region and τt = 4913 s for the model with ξ = 1.3. The fitted value Tξ = 1.3 falls within ~35 s (~2%) of the resulting theoretical value Tov = 2132 s, the shift Tξ = 1.3 − Tov being similar to that found for the Sun by Roxburgh (2009).
Fit of the signal S ≡ Δrr01/10(n) = rr01/10(n)S − rr01/10(n)ξ = 0.
The same procedure was applied to the observed signal, which is compared to the model with ξ = 0.0 and the sinusoidal fits are plotted in Fig. 4. The results of the fits ( ) are listed in Table 1. The period Tobs = 2100 ± 100 s agrees quite well with that derived for model ξ = 1.3. We conclude that the base of the adiabatically stratified region of HD 52265 is located within 2% of the radius rov/R = 0.800 ± 0.004.
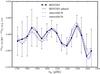 |
Fig. 4 Difference of the ratios rr01/10(n) as a function of frequency between the standard model (no PC, ξ = 0.0) and the raw observations (black) or a spline fit of observations (continuous blue line). The dashed lines are the fits of the raw and splined data (see Table 1). |
5. Conclusions
We have detected an oscillatory signal with a significant amplitude in the variation of the separations rr01/10(n) with frequency
for the CoRoT star HD 52265. A comparison with the same signal arising from appropriate stellar models shows that it cannot be reproduced unless PC is included at the base of the outer convective envelope. This is the first time that such a feature is firmly detected in a star other than the Sun. A best fit of the signal provides a measure of the extent of the mixed region below the CZ, in terms of the proxy dov = 0.95 ± 0.08 Hp.
The periodic signal for HD 52265 is more pronounced than for the Sun (Christensen-Dalsgaard et al. 2011), with a longer period, and so is the measured extent of PC in terms of Hp and normalized radius. We point out that HD 52265 is similar to the Sun in all aspects except for the higher metallicity. Therefore, to understand the amplitude difference between the two stars, it is important to investigate the impact of metallicity on the structure and dynamics of the tachocline. Progress is expected in a near future when seismic missions will provide similar observations for many stars spanning a wide metallicity range.
With the above results, we provided an additional clue that the physical description of the turbulent convection must be improved in stars, particularly at interfaces with radiative regions. Future modelling of the dynamics in the region of the tachocline will have to comply with our findings as well as with the results previously obtained for the Sun.
References
- Baglin, A., Auvergne, M., Barge, P., et al. 2002, in Stellar Structure and Habitable Planet Finding, eds. B. Battrick, F. Favata, I. W. Roxburgh, & D. Galadi, ESA Spec. Publ., 485, 17 [Google Scholar]
- Ballot, J., Gizon, L., Samadi, R., et al. 2011, A&A, 530, A97 [NASA ADS] [CrossRef] [EDP Sciences] [Google Scholar]
- Basu, S., Mazumdar, A., Antia, H. M., & Demarque, P. 2004, in SOHO 14 Helio- and Asteroseismology: Towards a Golden Future, ed. D. Danesy, ESA Spec. Publ., 559, 313 [NASA ADS] [Google Scholar]
- Berthomieu, G., Morel, P., Provost, J., & Zahn, J.-P. 1993, in Inside the Stars, eds. W. W. Weiss, & A. Baglin, IAU Colloq., 137, ASP Conf. Ser., 40, 60 [Google Scholar]
- Christensen-Dalsgaard, J., Monteiro, M. J. P. F. G., Rempel, M., & Thompson, M. J. 2011, MNRAS, 414, 1158 [NASA ADS] [CrossRef] [Google Scholar]
- Escobar, M. E., Théado, S., Vauclair, S., et al. 2012, A&A, 543, A96 [NASA ADS] [CrossRef] [EDP Sciences] [Google Scholar]
- Gough, D. O. 1990, in Progress of Seismology of the Sun and Stars, eds. Y. Osaki, & H. Shibahashi, Lecture Notes in Physics (Berlin: Springer Verlag), 367, 283 [Google Scholar]
- Grevesse, N., & Noels, A. 1993, in Origin and Evolution of the Elements, eds. N. Prantzos, E. Vangioni-Flam, & M. Casse, 15 [Google Scholar]
- Houdek, G., & Gough, D. O. 2007, MNRAS, 375, 861 [NASA ADS] [CrossRef] [Google Scholar]
- Kjeldsen, H., Bedding, T. R., & Christensen-Dalsgaard, J. 2008, ApJ, 683, L175 [NASA ADS] [CrossRef] [Google Scholar]
- Koch, D., Borucki, W., Jenkins, J., et al. 2010, in 38th COSPAR Scientific Assembly, 38, 2513 [Google Scholar]
- Lebreton, Y. 2011 [arXiv:1108.6153] [Google Scholar]
- Mazumdar, A. 2005, A&A, 441, 1079 [NASA ADS] [CrossRef] [EDP Sciences] [Google Scholar]
- Miglio, A., & Montalbán, J. 2005, A&A, 441, 615 [NASA ADS] [CrossRef] [EDP Sciences] [Google Scholar]
- Monteiro, M. J. P. F. G., Christensen-Dalsgaard, J., & Thompson, M. J. 1994, A&A, 283, 247 [NASA ADS] [Google Scholar]
- Monteiro, M. J. P. F. G., Christensen-Dalsgaard, J., & Thompson, M. J. 2000, MNRAS, 316, 165 [NASA ADS] [CrossRef] [Google Scholar]
- Morel, P., & Lebreton, Y. 2008, Ap&SS, 316, 61 [NASA ADS] [CrossRef] [MathSciNet] [Google Scholar]
- Otí Floranes, H., Christensen-Dalsgaard, J., & Thompson, M. J. 2005, MNRAS, 356, 671 [NASA ADS] [CrossRef] [Google Scholar]
- Roxburgh, I. W. 1993, in GONG 1992, Seismic Investigation of the Sun and Stars, ed. T. M. Brown, ASP Conf. Ser., 42, 173 [Google Scholar]
- Roxburgh, I. W. 2009, A&A, 493, 185 [NASA ADS] [CrossRef] [EDP Sciences] [Google Scholar]
- Roxburgh, I. W., & Vorontsov, S. V. 1994, MNRAS, 268, 880 [NASA ADS] [CrossRef] [Google Scholar]
- Roxburgh, I. W., & Vorontsov, S. V. 2003, A&A, 411, 215 [NASA ADS] [CrossRef] [EDP Sciences] [Google Scholar]
- Scuflaire, R., Montalbán, J., Théado, S., et al. 2008, Ap&SS, 316, 149 [NASA ADS] [CrossRef] [Google Scholar]
- Tassoul, M. 1980, ApJS, 43, 469 [NASA ADS] [CrossRef] [Google Scholar]
- van Leeuwen, F. 2007, Astrophysics and Space Science Library, 350, Hipparcos, the New Reduction of the Raw Data [Google Scholar]
- VandenBerg, D. A., & Clem, J. L. 2003, AJ, 126, 778 [NASA ADS] [CrossRef] [Google Scholar]
- Verner, G. A., Chaplin, W. J., & Elsworth, Y. 2006, ApJ, 638, 440 [NASA ADS] [CrossRef] [Google Scholar]
- Zahn, J.-P. 1991, A&A, 252, 179 [NASA ADS] [Google Scholar]
All Tables
All Figures
|
Fig. 1 Observed ratios rr01/10(n) (black squares) as a function of frequency νn,0/n,1 for HD 52265 compared to the rr01/10(n) ratios in the models without PC (ξ = 0.0, magenta) and with PC (ξ = 1.3, red). |
| In the text | |
|
Fig. 2 Top: temperature gradient as a function of radius in a model with penetrative convection (continuous line) and a standard model (dashed line) of HD 52265. Bottom: sound speed gradient with respect to the acoustic depth |
| In the text | |
|
Fig. 3 Difference of the ratios rr01/10(n) as a function of frequency between the standard model (no PC, ξ = 0.0) and (i) the model with PC with an extent of ξ = 1.3 (red continuous line), (ii) the observations (black). The dashed red line is a sinusoidal fit of the red curve (see text). Note that to calculate the differences, models were splined on the observed frequency grid. A detailed comparison with observations is provided in Fig. 4. |
| In the text | |
|
Fig. 4 Difference of the ratios rr01/10(n) as a function of frequency between the standard model (no PC, ξ = 0.0) and the raw observations (black) or a spline fit of observations (continuous blue line). The dashed lines are the fits of the raw and splined data (see Table 1). |
| In the text | |
Current usage metrics show cumulative count of Article Views (full-text article views including HTML views, PDF and ePub downloads, according to the available data) and Abstracts Views on Vision4Press platform.
Data correspond to usage on the plateform after 2015. The current usage metrics is available 48-96 hours after online publication and is updated daily on week days.
Initial download of the metrics may take a while.