Fig. 7
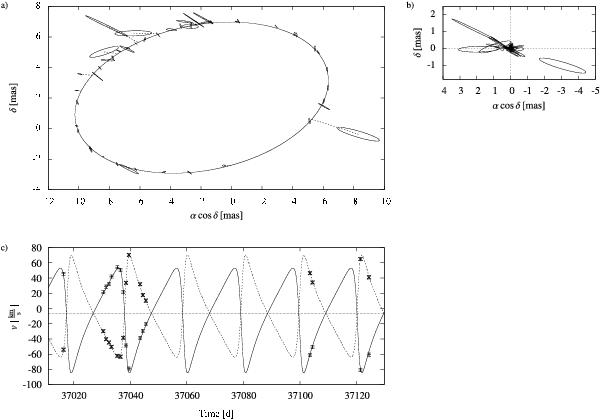
AM and RV data and models calculated with the MAP parameter estimates (Table B.1). a) AM data (uncertainty ellipses, solid lines), model (large ellipse, solid line) and residual vectors (dashed lines). b) Residual AM error ellipses. c) RV data and model for primary (normal error bars, solid line) and secondary (hourglass-shaped error bars, dotted line). The horizontal dashed line indicates the RV offset V. RV residuals are presented in Fig. 8.
Current usage metrics show cumulative count of Article Views (full-text article views including HTML views, PDF and ePub downloads, according to the available data) and Abstracts Views on Vision4Press platform.
Data correspond to usage on the plateform after 2015. The current usage metrics is available 48-96 hours after online publication and is updated daily on week days.
Initial download of the metrics may take a while.