Fig. 1
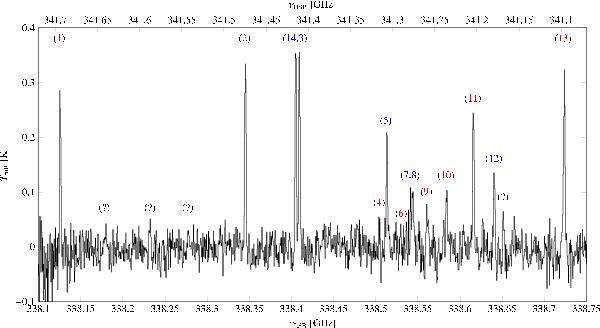
CH3OH averaged spectrum obtained on 13.95 UT January 2005. The lower and upper x-axis scales represent the frequency of the lower and upper sidebands, respectively. Labels indicate detected CH3OH spectral lines listed in Table 3. There is a blend of three A and A emission lines at 338.513 GHz (label 5). The observed line at 338.722 GHz is a blend of two E components (label 13). The A line at 341.416 GHz (label 14) is in the upper sideband close to the A transition at 338.409 GHz (label 3). A marginal detection of the E line at 338.530 GHz is indicated by label 6. The unidentified emission features labeled by (?) are discussed in Sect. 3.2.
Current usage metrics show cumulative count of Article Views (full-text article views including HTML views, PDF and ePub downloads, according to the available data) and Abstracts Views on Vision4Press platform.
Data correspond to usage on the plateform after 2015. The current usage metrics is available 48-96 hours after online publication and is updated daily on week days.
Initial download of the metrics may take a while.