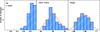
Fig. 10

Summary of the analysis of the gradients of a set of physical properties of the H ii regions in the considered galaxies. Each panel shows, from left to right, (i) the distribution of correlations coefficients of a each of the considered parameter (from top to bottom: the surface brightness, the oxygen abundance and the dust attenuation) with respect to the radial distance; (ii) the distribution of the zero-points of the linear regression and (iii) the distribution of the slope of the same regression. The orange solid line represents, for each of the last two histograms, the expected histogram in case of a Gaussian distribution of the data, assuming the mean and standard-deviation of the distribution of each analysed parameter, and sampled with same bins.


Current usage metrics show cumulative count of Article Views (full-text article views including HTML views, PDF and ePub downloads, according to the available data) and Abstracts Views on Vision4Press platform.
Data correspond to usage on the plateform after 2015. The current usage metrics is available 48-96 hours after online publication and is updated daily on week days.
Initial download of the metrics may take a while.