Fig. A.1
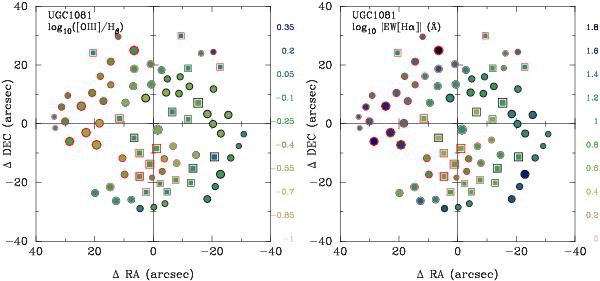
Left-panel: spatial distribution of the [O iii]/Hβ line ratio along the spatial extension of the UGC 1081 galaxy, derived from the analysis of the H ii regions. Each symbol corresponds to a H ii region, its filling colour corresponding to the shown parameter, scaled as displayed in the right-size colour-table. Red symbols correspond to H ii regions associated with arm 1, and black ones correspond to those associated with arm 2 (where the indexing of the arms was selected in arbitrary way). Grey symbols represent H ii regions without a clear association with a particular arm, following the criteria described in Sect. 5. The circles represent those H ii regions below the Kauffmann et al. (2003) demarcation line in the BPT diagram shown in Fig. 7, and the squares corresponds to those ones located in the intermediate region between that line and the Kewley et al. (2001) one. The size of the symbols are proportional to the Hα intensity. Right-panel: similar spatial distribution for the absolute value of the equivalent width of Hα in logarithm scale. Symbols are similar to those described for the left panel.
Current usage metrics show cumulative count of Article Views (full-text article views including HTML views, PDF and ePub downloads, according to the available data) and Abstracts Views on Vision4Press platform.
Data correspond to usage on the plateform after 2015. The current usage metrics is available 48-96 hours after online publication and is updated daily on week days.
Initial download of the metrics may take a while.