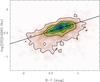
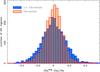
Fig. B.1

left panel: distribution of the [N ii]/Hα line ratio along the B − V colour for all the detected H ii regions. The image and contours show the density distribution in this space of parameters. The first contour is at the mean density, with a regular spacing of four times this value for each consecutive contour. The solid line shows the actual regression found between the two represented parameters. Right panel: histograms of the relative difference between the Hα intensity derived from the narrow band images described in Sect. 3, and the ones derived from the fitting technique over the extracted spectra, described in Sect. 6.1, before (blue-solid histogram) and after (red-shaded histogram) applying the correction from the [N ii] contamination based on the correlation shown in the left-panel.
Current usage metrics show cumulative count of Article Views (full-text article views including HTML views, PDF and ePub downloads, according to the available data) and Abstracts Views on Vision4Press platform.
Data correspond to usage on the plateform after 2015. The current usage metrics is available 48-96 hours after online publication and is updated daily on week days.
Initial download of the metrics may take a while.