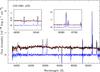
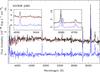
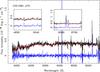
Fig. 5
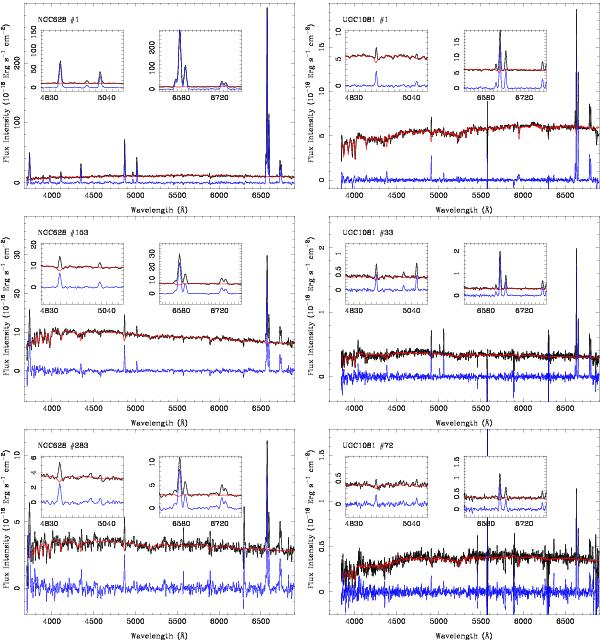
Spectra of three typical H ii regions for two different galaxies, NGC 628 (left panels), and UGC 1081 (right panels). The panels correspond, from top to bottom, to the brightest, average and faintest H ii regions with good quality data for each particular object. The spectral range shows all the emission lines analysed in this article. From top to bottom: each panel shows the integrated spectra of the considered H ii region (solid-black), together with the best model for the underlying stellar population (solid-red), and the pure-gas spectra (solid-blue). The two boxes show a zoom of the same plots at the Hβ and Hα wavelength range.
Current usage metrics show cumulative count of Article Views (full-text article views including HTML views, PDF and ePub downloads, according to the available data) and Abstracts Views on Vision4Press platform.
Data correspond to usage on the plateform after 2015. The current usage metrics is available 48-96 hours after online publication and is updated daily on week days.
Initial download of the metrics may take a while.