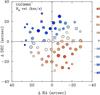
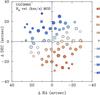
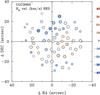
Fig. 6
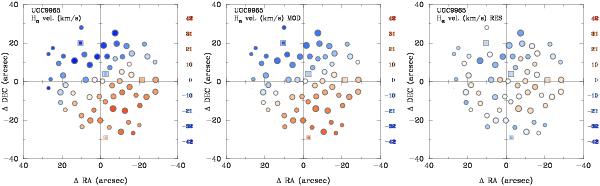
Left-panel: Hα velocity field derived from the analysis of the H ii regions for UGC 9965. Central-panel: best model fitted to the velocity map using a simple arctan velocity curve, and fitting the inclination, position angle and maximum rotational velocity. Right-panel: residual of the subtraction of the model to the velocity map. Each plotted symbol in each panel represent an individual H ii region. The circles represent those H ii regions below the Kauffmann et al. (2003) demarcation line in the classical BPT diagram (Baldwin et al. 1981), and the squares corresponds to those ones located in the intermediate region between that line and the Kewley et al. (2001) one, as described later in the text. The size of the symbols are proportional to the Hα intensity.
Current usage metrics show cumulative count of Article Views (full-text article views including HTML views, PDF and ePub downloads, according to the available data) and Abstracts Views on Vision4Press platform.
Data correspond to usage on the plateform after 2015. The current usage metrics is available 48-96 hours after online publication and is updated daily on week days.
Initial download of the metrics may take a while.