Fig. 3
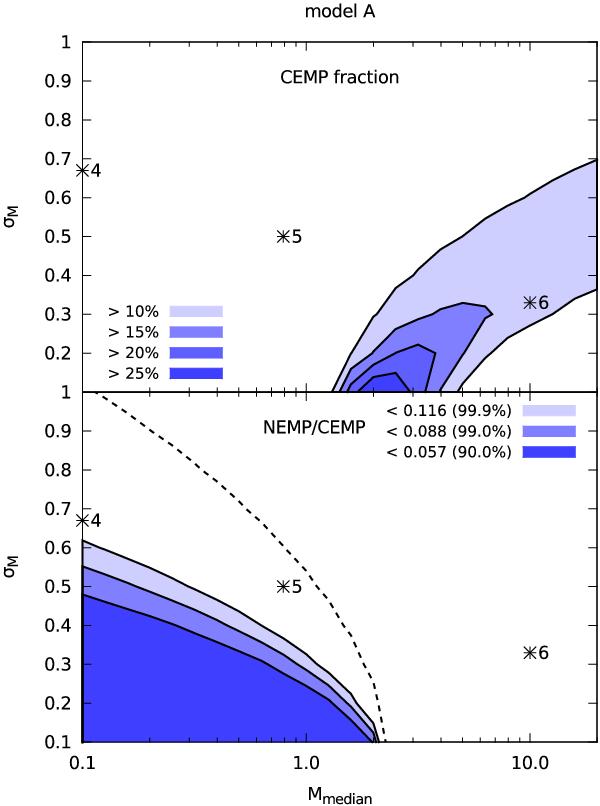
Dependence of the CEMP fraction (upper panel) and the fraction fNEMP of NEMP stars among all CEMP+NEMP stars (lower panel) for our default model A, as a function of the median mass Mmed and dispersion σM for a log-normal IMF. Contours in the upper panel correspond to CEMP fractions between 10% and 25%, which spans the range of observed values. The solid contours in the lower panel correspond to the 90%, 99% and 99.9% confidence upper limits on fNEMP in the range −2.8 ≤ [Fe/H] ≤ −1.8 and log g ≤ 4, while the dashed line shows the 99% upper limit on fCNEMP (see Table 2). The star symbols labelled 4, 5 and 6 indicate the IMFs of Miller & Scalo (1979), Lucatello et al. (2005a) and Komiya et al. (2007).
Current usage metrics show cumulative count of Article Views (full-text article views including HTML views, PDF and ePub downloads, according to the available data) and Abstracts Views on Vision4Press platform.
Data correspond to usage on the plateform after 2015. The current usage metrics is available 48-96 hours after online publication and is updated daily on week days.
Initial download of the metrics may take a while.