Fig. 4
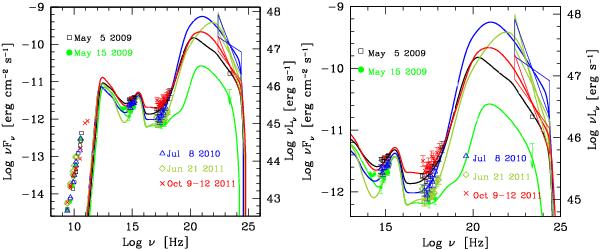
(Left panel) SEDs of PMN J0948 + 0022 in some specific time periods. (Right panel) Zoom of the infrared-to-γ-ray energy range. Each period is indicated with different symbols and colours, as displayed in the figures. Since we adopted a one-zone model, radio data were not fitted. The bow-ties at γ-rays indicate only the changes in the photon index that are most relevant for the modelling. It is necessary to take into account that the flux normalisation also has an error, although not displayed. See the text for details.
Current usage metrics show cumulative count of Article Views (full-text article views including HTML views, PDF and ePub downloads, according to the available data) and Abstracts Views on Vision4Press platform.
Data correspond to usage on the plateform after 2015. The current usage metrics is available 48-96 hours after online publication and is updated daily on week days.
Initial download of the metrics may take a while.