| Issue |
A&A
Volume 548, December 2012
|
|
|---|---|---|
| Article Number | A106 | |
| Number of page(s) | 14 | |
| Section | Extragalactic astronomy | |
| DOI | https://doi.org/10.1051/0004-6361/201220225 | |
| Published online | 30 November 2012 | |
Online material
Appendix A: Light curves
Light curves of all the data available and studied in the present work are displayed in the following. Figures A.1–A.3 are also available as tables in electronic form at the CDS.
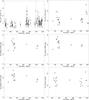 |
Fig. A.1
Light curves at various frequencies. From top left to bottom right panel: γ-ray 0.1–300 GeV from Fermi/LAT, with 1 day time bin [10-7 ph cm-2 s-1] (the horizontal dotted line correspond to a TS = 4 average upper limit of 2.3 × 10⁻⁷ ph cm-2 s-1 for a one-day exposure); X-ray 0.3–10 keV from Swift/XRT [c s-1]; UVW2 from Swift/UVOT [mJy]; UVM2 from Swift/UVOT [mJy]; UVW1 from Swift/UVOT [mJy]; U from Swift/UVOT [mJy]. Time starts on 2008 August 1 00:00 UTC (MJD 54 679). |
| Open with DEXTER | |
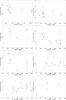 |
Fig. A.2
Light curves at various frequencies. From top left to bottom right panel: B from Swift/UVOT [mJy]; V from Swift/UVOT [mJy]; J from INAOE [mJy]; H from INAOE [mJy]; K from INAOE [mJy]; 142 GHz from IRAM [Jy]; 86 GHz from IRAM [Jy]; 43 GHz from Effelsberg [Jy]. Time starts on 2008 August 1 00:00 UTC (MJD 54 679). |
| Open with DEXTER | |
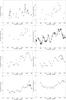 |
Fig. A.3
Light curves at various frequencies. From top left to bottom right panel: 37 GHz from Metsähovi [Jy]; 32 GHz from Effelsberg [Jy]; 23 GHz from Effelsberg [Jy]; 15 GHz from OVRO (open squares), Effelsberg (filled circles), and MOJAVE (open triangles) [Jy]; 10.45 GHz from Effelsberg [Jy]; 8.4 GHz from Effelsberg (filled circles) and Medicina (filled stars) [Jy]; 5.0 GHz from Effelsberg (filled circles) and Medicina (filled stars) [Jy]; 2.64 GHz from Effelsberg [Jy]. Time starts on 2008 August 1 00:00 UTC (MJD 54 679). |
| Open with DEXTER | |
© ESO, 2012
Current usage metrics show cumulative count of Article Views (full-text article views including HTML views, PDF and ePub downloads, according to the available data) and Abstracts Views on Vision4Press platform.
Data correspond to usage on the plateform after 2015. The current usage metrics is available 48-96 hours after online publication and is updated daily on week days.
Initial download of the metrics may take a while.