Fig. 6
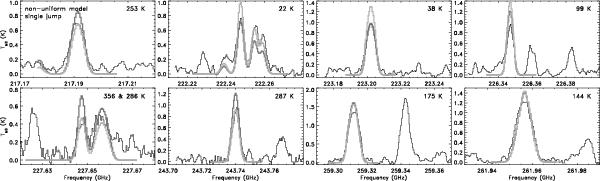
Selected emission lines for CH3OCH3, ν= 0, over-plotted with the best-fit non-uniform LIME model with a single jump of the CH3OCH3 abundance at 70 or 100 K (see Table 3). The observed spectrum is displayed in black, the model for CH3OCH3, ν= 0, with an abundance jump at 70 K in light grey and at 100 K in dark grey. The value of Eu for each transition is given in the upper right corner of each panel.
Current usage metrics show cumulative count of Article Views (full-text article views including HTML views, PDF and ePub downloads, according to the available data) and Abstracts Views on Vision4Press platform.
Data correspond to usage on the plateform after 2015. The current usage metrics is available 48-96 hours after online publication and is updated daily on week days.
Initial download of the metrics may take a while.