Fig. 3
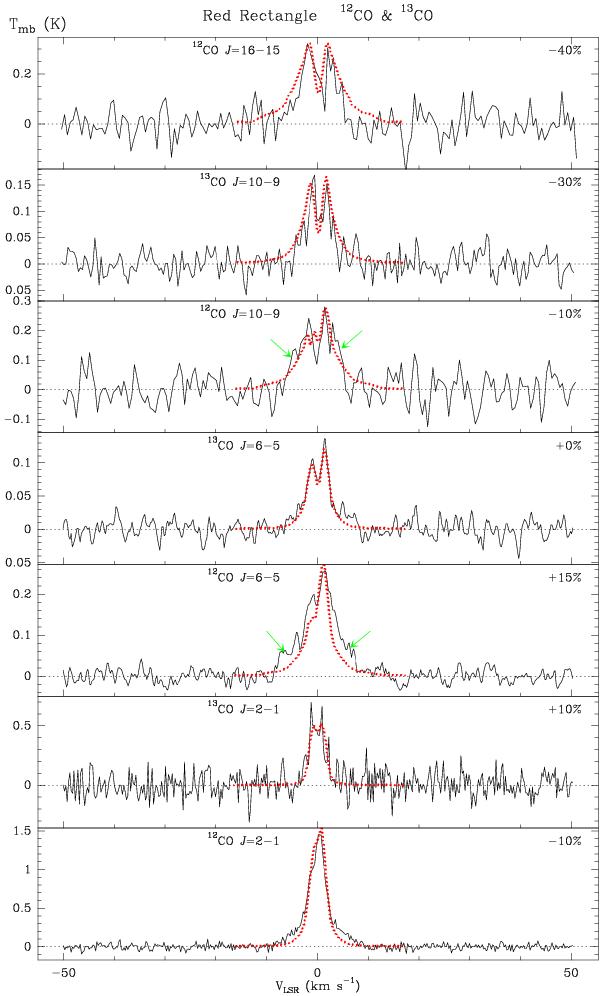
Observed profiles of the mm- and submm-wave transitions (black) and predictions of our code (red points), assuming that the disk region closer than 2 × 1015 cm to the axis is hotter and denser by a factor 2 than in our standard model, Table 2. The symbols have the same meaning as in Fig. 1, note the values of the free scale parameter used in this case.
Current usage metrics show cumulative count of Article Views (full-text article views including HTML views, PDF and ePub downloads, according to the available data) and Abstracts Views on Vision4Press platform.
Data correspond to usage on the plateform after 2015. The current usage metrics is available 48-96 hours after online publication and is updated daily on week days.
Initial download of the metrics may take a while.