Fig. 3
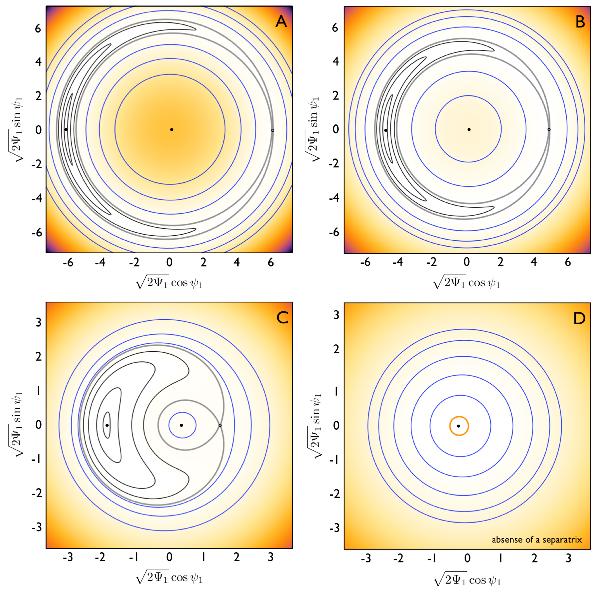
Level curves of the Hamiltonian (29). The plotted energy levels correspond to the Hamiltonian characterized by the mass-ratio and angular momentum equivalent to that of the 2:1 resonant HD 82943 system (see Table 1 as well as Fig. 4). The four dynamical portraits depicted in panels labeled A) B) C) D) exhibit different proximities to exact resonance. Specifically, the associated values of Φ2 are A) Φ2 = 1.6 × 10⁻⁴; B) Φ2 = 4.8 × 10⁻⁴; C) Φ2 = 9.6 × 10⁻⁴; D) Φ2 = 1.12 × 10⁻³. Note that the dynamical portraits shown in panels A), B) and C) feature the presence of separatrcies, shown as thick gray curves. The separatrix disappears in panel D), although libration of the critical angle is still possible, as depicted by the thick orange circle. Note the factor of two reduction in the axes ranges between panels A) and B) and C) and D).
Current usage metrics show cumulative count of Article Views (full-text article views including HTML views, PDF and ePub downloads, according to the available data) and Abstracts Views on Vision4Press platform.
Data correspond to usage on the plateform after 2015. The current usage metrics is available 48-96 hours after online publication and is updated daily on week days.
Initial download of the metrics may take a while.