Fig. 4
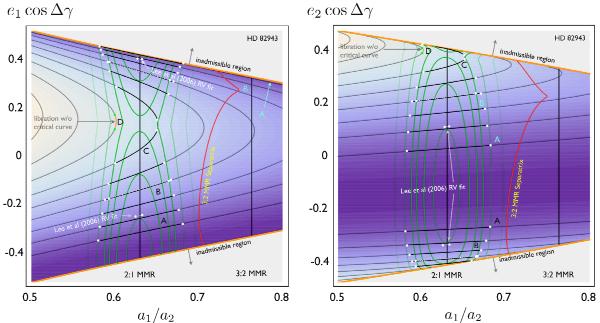
Geometrical representation of the resonant dynamics. As in Fig. 3, the mass-ratio and angular momentum are chosen to be equivalent to that of the 2:1 resonant HD 82943 system (see Table 1). The two panels depict the surfaces of section of the dynamical evolution with respect to Δγ, taken at Δγ = 0, ± π. As described in the text, showing both e1 and e2 is redundant and from the figures it can be understood that the two surfaces of section are a simple rotation away from each-other. In both panels, the permissible region is defined by a combination of the constants of motion  & Ω and is in essence dictated by the angular momentum of a given system. Contours of Ψ2 are shown as black lines and the background color is indicative of the value of Ψ2. Namely, the dark blue region corresponds to a Ψ2 minimum. For each plotted value of Ψ2, the separatrix is mapped onto the figure using white dots. Maximal libration amplitudes for Ψ2 levels that allow for the existence of a critical curve are traced along the corresponding contours with thick black lines. Maximal pseudo-resonant libration widths (i.e. those coresponding to Ψ2 levels that do not allow for the existence of separatricies) are shown as thick orange lines and are bounded by yellow (caution: these points may appear green on some monitors and/or printers), rather than white dots. The Ψ2 contours labeled A B C D parallel the dynamical portraits depicted in Fig. 3. The green vertical lines show constant energy levels. The approximate location of the separatrix of the neighboring 3:2 mean motion resonance is shown as a red curve. The (Lee et al. 2006) fit to the radial velocity data is shown with a gray line. The dashed white line depicts the initial condition of the system considered in Sect. 3.2.
Current usage metrics show cumulative count of Article Views (full-text article views including HTML views, PDF and ePub downloads, according to the available data) and Abstracts Views on Vision4Press platform.
Data correspond to usage on the plateform after 2015. The current usage metrics is available 48-96 hours after online publication and is updated daily on week days.
Initial download of the metrics may take a while.