Fig. 3
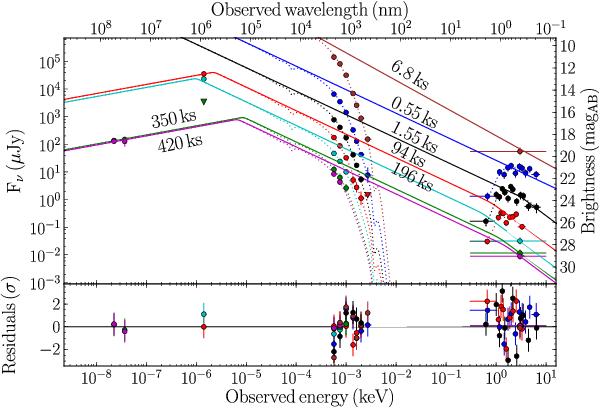
Multi-epoch SEDs (different colours) of the late-time afterglow of GRB 100621A as measured by Swift/XRT (right; not NH-corrected), GROND (middle; not AV-corrected)), APEX/LABOCA (middle left), and ATCA (far left), together with a broad-band model which fits all data available for the given epoch. The times of these SEDs are marked with vertical lines in Fig. 2, and the resulting break energies given in Table 4. Since the optical/NIR and X-ray fluxes in epochs 1−3 are very similar, epoch 3 (jump component at 6.8 ks) has been scaled upwards by a factor of 20, and epoch 2 (flares) down-scaled by a factor of 4. The curvature in the GROND data is due to strong extinction of the afterglow light in the host galaxy (dotted line). The breaks seemingly show erratic variations in frequency – see text for an interpretation. We do not consider the fits in this plot to be the final physical interpretation of the data, as it links emission components at different wavelength regions that do not belong together (see text).
Current usage metrics show cumulative count of Article Views (full-text article views including HTML views, PDF and ePub downloads, according to the available data) and Abstracts Views on Vision4Press platform.
Data correspond to usage on the plateform after 2015. The current usage metrics is available 48-96 hours after online publication and is updated daily on week days.
Initial download of the metrics may take a while.