Fig. 13
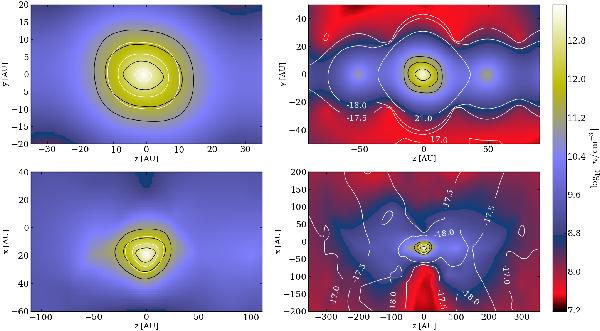
Comparison between the CR ionisation rate distribution obtained by using the fitting formula (Eq. (16)) from Umebayashi & Nakano (2009) considering rectilinear propagation, black contours, and Eq. (5), white contours, for rectilinear propagation (left panels) and following the path of CRs along field lines with the inclusion of mirroring and focusing effects (right panels). The three concentric black contours in all the panels as well as the white contours in the left panels refer to log 10 (ζH2/s-1) = −17.5, −18, −21 going inwards. Labels are on a logarithmic scale and the colour coding shows the density distribution. Upper panels: model C; lower panels: model E of Table 1.
Current usage metrics show cumulative count of Article Views (full-text article views including HTML views, PDF and ePub downloads, according to the available data) and Abstracts Views on Vision4Press platform.
Data correspond to usage on the plateform after 2015. The current usage metrics is available 48-96 hours after online publication and is updated daily on week days.
Initial download of the metrics may take a while.