Fig. 15
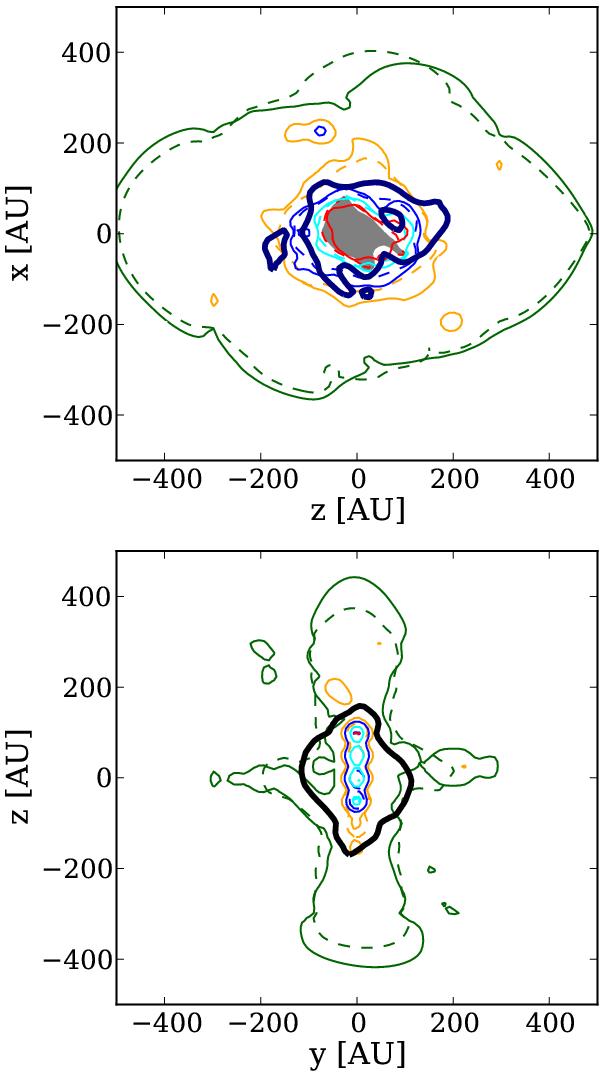
Comparison between the CR ionisation rate evaluated with the code described in the paper, solid contours, and with Eq. (23), dashed contours for the case C in Table 1. The grey shaded area shows the region where the difference among contours is larger than a factor of 3 and the black solid contour refers to the region where | B| = 1 G. Green, orange, blue, cyan, and red contours are related to log 10(ζH2/s-1) = −17, −17.5, −18, −19, and −20, respectively.
Current usage metrics show cumulative count of Article Views (full-text article views including HTML views, PDF and ePub downloads, according to the available data) and Abstracts Views on Vision4Press platform.
Data correspond to usage on the plateform after 2015. The current usage metrics is available 48-96 hours after online publication and is updated daily on week days.
Initial download of the metrics may take a while.