Fig. 3
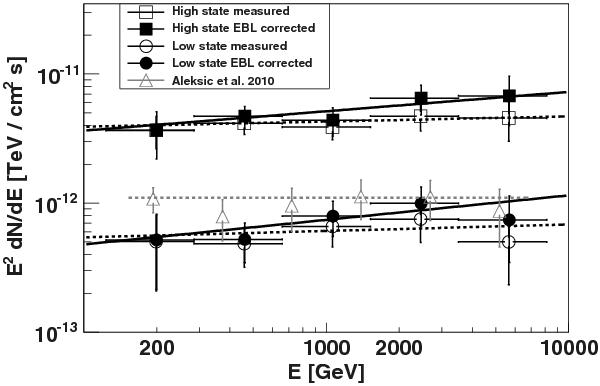
Measured (open markers) and EBL-absorption corrected (filled markers) spectral energy distribution for IC 310 obtained by MAGIC in high and low states together with their power-law fits in dashed line (measured) and solid line (EBL corrected). Fit parameters are given in Table 2. For comparison, we show the result reported in Aleksić et al. (2010) (grey triangles, without EBL de-absorption) for the whole period using only the closest pointing observations.
Current usage metrics show cumulative count of Article Views (full-text article views including HTML views, PDF and ePub downloads, according to the available data) and Abstracts Views on Vision4Press platform.
Data correspond to usage on the plateform after 2015. The current usage metrics is available 48-96 hours after online publication and is updated daily on week days.
Initial download of the metrics may take a while.