Free Access
Fig. 5
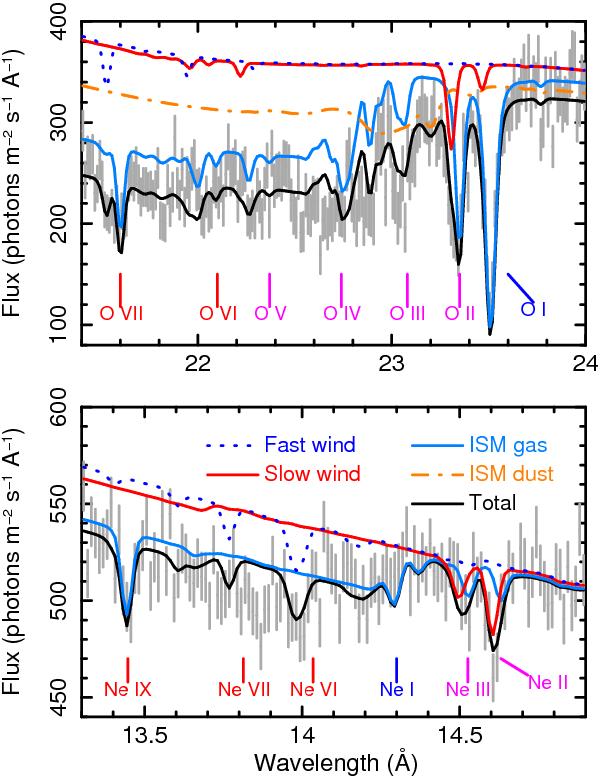
Chandra/LETGS data and joint RGS–LETGS model (see Table 5) near the oxygen (top panel) and neon (bottom panel) edges. The contributions of the main absorbers are also plotted. Dust is not shown near the Ne K edge because neon is not present in dust. Labels show the lines at their rest wavelengths.
Current usage metrics show cumulative count of Article Views (full-text article views including HTML views, PDF and ePub downloads, according to the available data) and Abstracts Views on Vision4Press platform.
Data correspond to usage on the plateform after 2015. The current usage metrics is available 48-96 hours after online publication and is updated daily on week days.
Initial download of the metrics may take a while.