Free Access
Fig. 6
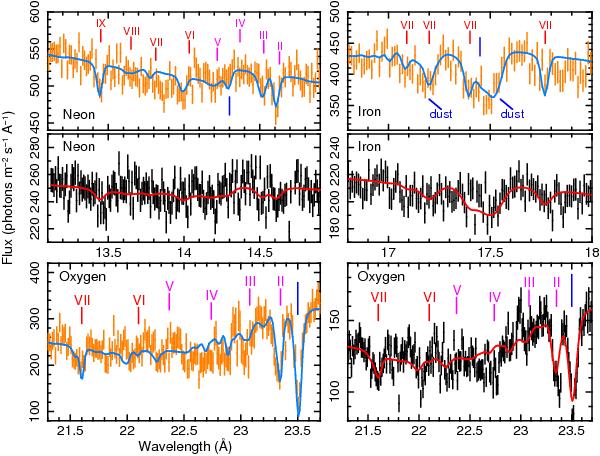
Full-band joint RGS–LETGS fits (see also Table 5, first column). Labels show the rest wavelengths and the ionization states of the lines. Blue marks provide the position of the neutral edges. Black points show the RGS spectrum, while the LETGS is in orange.
Current usage metrics show cumulative count of Article Views (full-text article views including HTML views, PDF and ePub downloads, according to the available data) and Abstracts Views on Vision4Press platform.
Data correspond to usage on the plateform after 2015. The current usage metrics is available 48-96 hours after online publication and is updated daily on week days.
Initial download of the metrics may take a while.