Free Access
Fig. 7
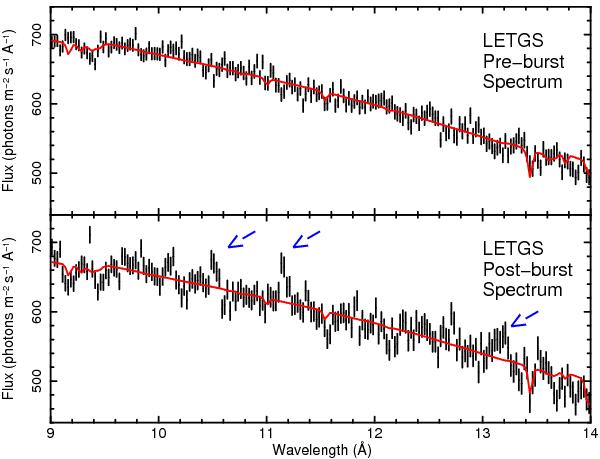
LETGS spectra before and after/including the burst events together with their models as given in Table 5. Note the emission-like features indicated by the blue arrows in the post-burst spectrum. Data have been binned by a factor of 2 for displaying purposes.
Current usage metrics show cumulative count of Article Views (full-text article views including HTML views, PDF and ePub downloads, according to the available data) and Abstracts Views on Vision4Press platform.
Data correspond to usage on the plateform after 2015. The current usage metrics is available 48-96 hours after online publication and is updated daily on week days.
Initial download of the metrics may take a while.