Fig. 3
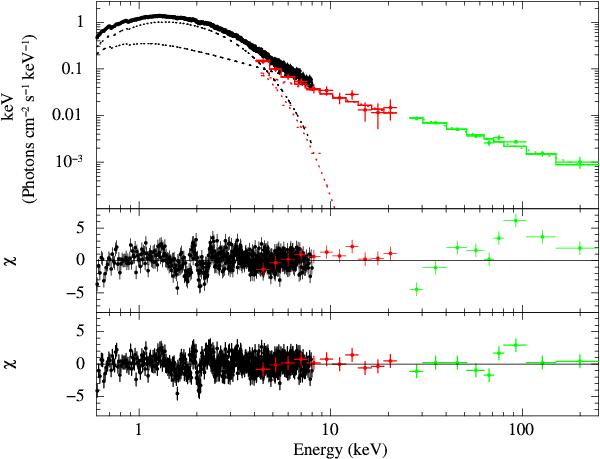
Averaged MAXI J1828-249 broad-band spectrum obtained by integrating over all available Swift/XRT (black), JEM-X (red) and ISGRI (green) data from MJD 56 580 to MJD 56 594 (“total” spectrum in Table 1). The best-fit model is shown with a solid line. The two dashed lines represent the spectral components (the multi-temperature disk black-body and the power-law). Residuals from the best fit are reported in the middle (no gain correction applied) and bottom panels (after gain correction). Some instrumental residuals are still visible at energies 1.5−2.5 keV also after the gain correction but their significance is strongly reduced.
Current usage metrics show cumulative count of Article Views (full-text article views including HTML views, PDF and ePub downloads, according to the available data) and Abstracts Views on Vision4Press platform.
Data correspond to usage on the plateform after 2015. The current usage metrics is available 48-96 hours after online publication and is updated daily on week days.
Initial download of the metrics may take a while.