Fig. 4
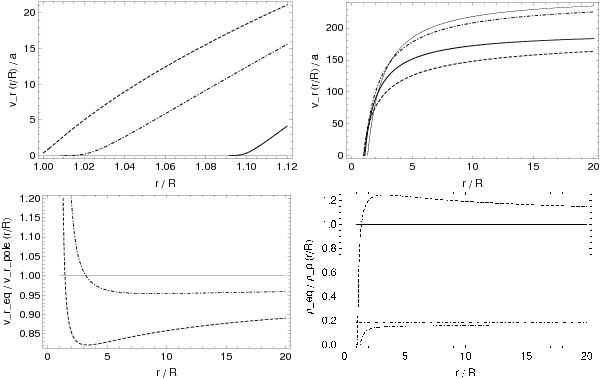
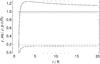
Model results for the wind from a differentially rotating O5–V main-sequence star considering its oblateness including gravity darkening effects with an equatorial rotation speed of Vrot = 300 km s-1 (see dashed curves) and 500 km s-1 (see dotted-dashed curves) at the equator (for θ = π/2), compared to the wind from the pole at θ = 0 (see solid curves or solid horizontal lines, respectively); as for the stellar and wind parameters see Table 3 in Sect. 4. All diagrams are plotted vs. radial distance  in units of the equatorial stellar core radius Rcore (Vrot,θ = π/2). Upper panel: the amount of the radial wind velocity component
  (in units of sound speed a) in the subsonic and lower supersonic wind regime (see left diagram), and in the supersonic region up to stellar distances of
  (see right diagram); the thick (thin) solid curves represent the radial wind velocity at the pole for Vrot = 300 km s-1 (500 km s-1). Lower panel: the left diagram displays the curves of the ratio
  of the equatorial radial wind velocity compared to the polar wind velocity and the right diagram shows the ratio
  of the equatorial wind density in terms of the density at the pole. For the pole, these ratios are simply represented by the (solid) constant lines at 1.0; at the equator the density ratios approach (for large stellar distances ) the terminal values represented by the thin horizontal dashed or dotted-dashed line, respectively, in the right diagram.
Current usage metrics show cumulative count of Article Views (full-text article views including HTML views, PDF and ePub downloads, according to the available data) and Abstracts Views on Vision4Press platform.
Data correspond to usage on the plateform after 2015. The current usage metrics is available 48-96 hours after online publication and is updated daily on week days.
Initial download of the metrics may take a while.