| Issue |
A&A
Volume 568, August 2014
|
|
|---|---|---|
| Article Number | C1 | |
| Number of page(s) | 3 | |
| Section | Interstellar and circumstellar matter | |
| DOI | https://doi.org/10.1051/0004-6361/201323293e | |
| Published online | 28 August 2014 | |
Herschel-Planck dust optical-depth and column-density maps (Corrigendum)
I. Method description and results for Orion
1 University of Milan, Department of Physics, via Celoria 16, 20133 Milan, Italy
e-mail: This email address is being protected from spambots. You need JavaScript enabled to view it.
2 Centro de Astrobiología, INTA-CSIC, PO Box 78, 28691 Villanueva de la Cañada, Madrid, Spain
3 University of Vienna, Türkenschanzstrasse 17, 1180 Vienna, Austria
4 Harvard-Smithsonian Center for Astrophysics, Mail Stop 72, 60 Garden Street, Cambridge, MA 02138, USA
Key words: ISM: clouds / dust, extinction / ISM: structure / ISM: individual objects: Orion molecular cloud / errata, addenda
Errors occurred during the production process. Figures 4, 16, 18, and 20 were published twice. The correct Figs. 3, 4, 15, 16, 17, 18, 19, and 20 are published below.
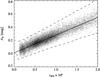 |
Fig. 3 Relationship between submillimeter optical-depth and NIR extinction in Orion A. The best linear fit, used to calibrate the data, is shown together with the expected 3σ region, as calculated from direct error propagation in the extinction map. |
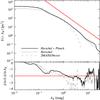 |
Fig. 15 Integral area-extinction relation for Orion A, i.e., the physical cloud area above a given extinction threshold (top panel), and the logarithmic derivative of this quantity (bottom panel). The solid black line shows the result for the entire field, while the solid gray line shows the region covered by Herschel alone. For comparison we also plot as a dashed gray line the same quantity as obtained from the 2MASS/Nicest extinction map and a simple S( > |

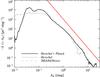 |
Fig. 17 Function − S′(>AK), that is, the probability distribution function (pdf) of the measured column densities for Orion A. In this log–log plot a log-normal distribution would appear as a parabola, and a power law as a straight line. The red line shows the slope of the power law |

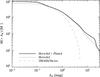 |
Fig. 19 Integral mass-extinction relation for Orion A, i.e. the cloud mass above a given extinction threshold. The color codes follow the same convention as in Fig. 15. |
© ESO, 2014
All Figures
|
Fig. 3 Relationship between submillimeter optical-depth and NIR extinction in Orion A. The best linear fit, used to calibrate the data, is shown together with the expected 3σ region, as calculated from direct error propagation in the extinction map. |
| In the text | |
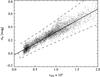 |
Fig. 4 Same as Fig. 3 for Orion B. |
| In the text | |
|
Fig. 15 Integral area-extinction relation for Orion A, i.e., the physical cloud area above a given extinction threshold (top panel), and the logarithmic derivative of this quantity (bottom panel). The solid black line shows the result for the entire field, while the solid gray line shows the region covered by Herschel alone. For comparison we also plot as a dashed gray line the same quantity as obtained from the 2MASS/Nicest extinction map and a simple S( > |
| In the text | |
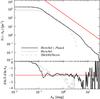 |
Fig. 16 Same as Fig. 15 for Orion B. |
| In the text | |
|
Fig. 17 Function − S′(>AK), that is, the probability distribution function (pdf) of the measured column densities for Orion A. In this log–log plot a log-normal distribution would appear as a parabola, and a power law as a straight line. The red line shows the slope of the power law |
| In the text | |
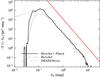 |
Fig. 18 Same as Fig. 17 for Orion B. |
| In the text | |
|
Fig. 19 Integral mass-extinction relation for Orion A, i.e. the cloud mass above a given extinction threshold. The color codes follow the same convention as in Fig. 15. |
| In the text | |
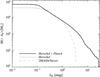 |
Fig. 20 Same as Fig. 19 for Orion B. |
| In the text | |
Current usage metrics show cumulative count of Article Views (full-text article views including HTML views, PDF and ePub downloads, according to the available data) and Abstracts Views on Vision4Press platform.
Data correspond to usage on the plateform after 2015. The current usage metrics is available 48-96 hours after online publication and is updated daily on week days.
Initial download of the metrics may take a while.