Fig. 14
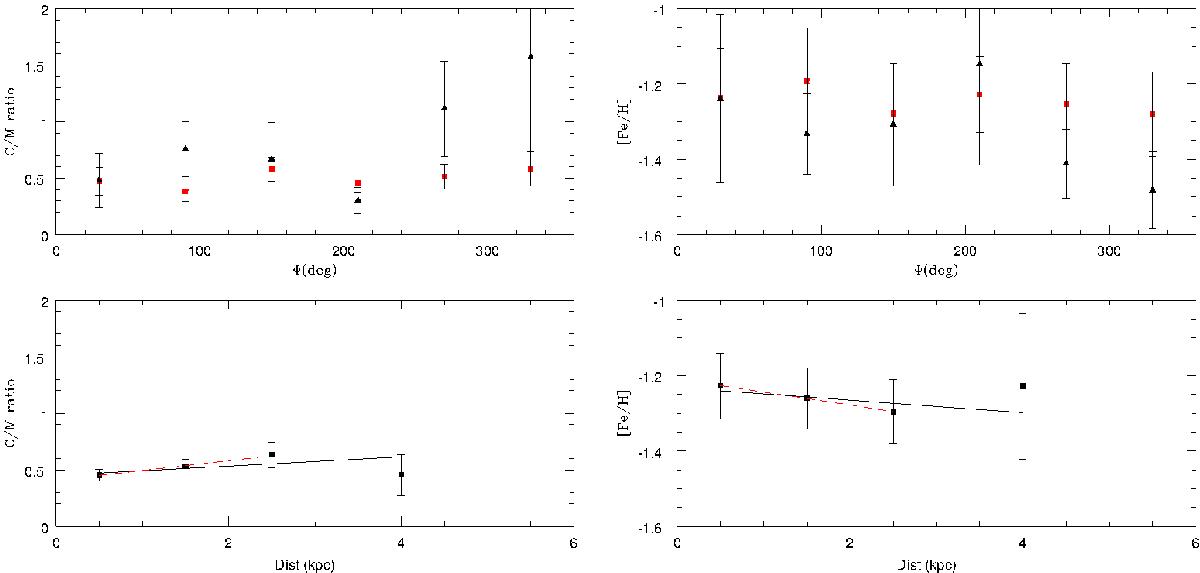
Top left panel: C/M ratio as a function of azimuthal angle for each of the segments shown in Fig. 13. The inner segments, 0−2 kpc (red squares), and the outer segments 2−4.5 kpc (black triangles) are shown separately. Bottom panel: C/M ratio as a function of distance from the galactic centre. The solid black line is a weighted linear fit to all four points, the red dashed line is also weighted but is only fitted to the first three points. Right: the same information is presented in the right hand panels for the [Fe/H] abundance, derived from the C/M ratio using the relation of Cioni (2009).
Current usage metrics show cumulative count of Article Views (full-text article views including HTML views, PDF and ePub downloads, according to the available data) and Abstracts Views on Vision4Press platform.
Data correspond to usage on the plateform after 2015. The current usage metrics is available 48-96 hours after online publication and is updated daily on week days.
Initial download of the metrics may take a while.