| Issue |
A&A
Volume 573, January 2015
|
|
|---|---|---|
| Article Number | A84 | |
| Number of page(s) | 15 | |
| Section | Extragalactic astronomy | |
| DOI | https://doi.org/10.1051/0004-6361/201423982 | |
| Published online | 23 December 2014 | |
The AGB population in IC 1613 using JHK photometry ⋆
1
School of Physics, Astronomy and Mathematics, University of
Hertfordshire,
College Lane,
Hatfield
AL10 9AB,
UK
e-mail:
This email address is being protected from spambots. You need JavaScript enabled to view it.
2
University of Cambridge, Institute of Astronomy,
Madingley Rd, Cambridge
CB3 OHA,
UK
Received: 11 April 2014
Accepted: 12 September 2014
Abstract
Context. A member of the Local Group, IC 1613 is a gas rich irregular dwarf galaxy that appears to have formed stars continuously over the last 10 Gyr and is relatively independent of external influences from other galaxies.
Aims. This paper aims to study the spatial distribution of the asymptotic giant branch (AGB) population in IC 1613 and its metallicity.
Methods. Using WFCAM on UKIRT, high quality JHK photometry of an area of 0.8 deg2 centered on IC 1613 was obtained. The data have been used to isolate the C- and M-type components of the AGB population and using their number ratio, C/M, a global mean metallicity has been derived. The metallicity and the tip of the red giant branch magnitude (TRGB) have been studied as a function of distance from the galactic centre and as a function of azimuthal angle.
Results. The TRGB has been found to be at K0 = 18.25 ± 0.15 mag. The colour separation between the C- and M-type components of the AGB population has been located at (J − K)0 = 1.15 ± 0.05 mag, giving a global C/M ratio of 0.52 ± 0.04 and from this an iron abundance of [Fe/H] = −1.26 ± 0.07 dex has been calculated.
Conclusions. The AGB population has been detected out to a radial distance of 4.5 kpc in the de-projected plane of the galaxy. The measured TRGB is consistent with previous measurements and no significant variation is detected in the TRGB or in metallicity either with galactocentric distance or azimuthal angle.
Key words: techniques: photometric / stars: AGB and post-AGB / stars: carbon / galaxies: dwarf / galaxies: stellar content / infrared: stars
Full Tables 1 and 2 are only available at the CDS via anonymous ftp to cdsarc.u-strasbg.fr (130.79.128.5) or via http://cdsarc.u-strasbg.fr/viz-bin/qcat?J/A+A/573/A84
© ESO, 2014
1. Introduction
The dwarf galaxy IC 1613 is frequently described as being Magellanic like or a “typical” dwarf irregular (dIrr). With a luminosity of MV = −14.9 mag it is ranked 6th in brightness among the dIrr’s of the Local Group (LG ; Battinelli & Demers 2009). At a distance of ~500 kpc from M 31, IC 1613 is more closely associated with that galaxy than the Milky Way (MW), although there is some disagreement in the literature as to whether it is a satellite of M 31 (Lake & Skillman 1989; McConnachie & Irwin 2006; Battinelli et al. 2007a). Estimates of the distance to IC 1613 from the MW have been made using several different distance-luminosity indicators including Cepheids (m − M)0 = 24.291 ± 0.035 (721 kpc) (Pietrzyński et al. 2006), RR Lyraes (m − M)0 = 24.10 ± 0.27 (660 kpc) (Saha et al. 1992), the tip of the red giant branch (TRGB) (m − M)0 = 24.29 ± 0.12 (721 kpc) (Cole et al. 1999) and the red clump (m − M)0 = 24.30 ± 0.09 (724 kpc) (Dolphin et al. 2001). Bernard et al. (2010) presented an average distance modulus of (m − M)0 = 24.40 ± 0.014 (758 kpc) based on their own derived value and those in the literature. We adopt this average value for our work, meaning 1′ equates to 0.22 kpc.
IC 1613 is a gas rich galaxy that appears to have experienced star formation over most of the life of the Universe as evidenced by the presence of an old (>10 Gyr) RR Lyrae population (Saha et al. 1992; Dolphin et al. 2001; Bernard et al. 2010), an intermediate-age (1−10 Gyr) red giant branch (RGB) and asymptotic giant branch (AGB) population (Freedman 1988; Jung et al. 2009) and a younger (<1 Gyr) blue population of stars (Hodge et al. 1991; Tautvaišienė et al. 2007). At present there seems to be only one recent and ongoing region of star formation, in the north east (NE) of the galaxy, but the hole in the H I gas in the south east (SE) suggests that there has been star formation in that region in the recent past (Lozinskaya 2002; Lake & Skillman 1989).
While star formation in IC 1613 has been effectively continuous the stellar population is dominated by stars formed at intermediate times (Cole et al. 1999). This is the result of variations in the rate of star formation with time and location, at least within the 7′ of the dynamic center of the galaxy (Skillman et al. 2003). Using optical photometry of a small field near the center of IC 1613, taken with the Wide-Field Planetary Camera 2 (WFPC2), Cole et al. (1999) estimated that the star formation rate (SFR) had declined by ~50% over the last 400−900 Myr and is currently ~3.5 × 10⁻⁴M⊙ yr-1. Skillman et al. (2003), who compared WFPC2 photometry of a second field approximately  south west of that observed by Cole et al. (1999) with colour-magnitude diagrams (CMDs) simulated from theoretical stellar models, also concluded that the SFR in IC 1613 had declined in the last Gyr; following a period of enhanced star formation between 3 and 6 Gyr ago. However, Skillman et al. (2003) found that the rate of decline differed between the inner and outer fields, with the SFR in the central field observed by Cole et al. (1999) maintaining a higher average level. More recently Skillman et al. (2014) used the HST Advanced Camera for Surveys (ACS) to obtain very deep (I ~ 29 mag) optical photometry of another field between the core and half-light radius of IC 1613. The depth of these observations means that they can reach a time resolution of ~1 Gyr at the oldest ages and Skillman et al. (2014) argue that the position of the observed field means that it can be treated as being representative of the global star formation history (SFH). They find that star formation has been nearly continuous, with an almost constant SFR during the first 6 Gyr and varying by, at most, a factor of two over the entire lifetime of the galaxy.
In addition to deep photometric studies of isolated fields near the centre of the galaxy, where the younger stars are concentrated, several studies have been made of the distribution and metallicity of the different stellar populations across IC 1613 in order to better understand its SFH. Albert et al. (2000) detected C-type stars out to a radius of 15′, while Battinelli et al. (2007a) traced the giant population out to 23′, finding though that the young main sequence population is restricted to the central portion of the galaxy (≤10′). The metallicity of IC1613 is often found to be comparable to the Small Magellanic Cloud or slightly more metal poor (Cole et al. 1999). Estimates of the iron abundance depend on the stellar population under investigation. Using optical photometry, Skillman et al. (2003) found that [Fe/H] has increased from −1.30 at the earliest times to −0.70 dex today. The same authors quoted abundances of −0.80 ± 0.20 dex and −1.07 dex for H II regions in the galaxy based on measurements of the nebular oxygen abundance made by Skillman et al. (1989) and Lee et al. (2003) respectively. This is consistent with the findings of Tautvaišienė et al. (2007), who estimated the overall metallicity of the young stellar population to be [Fe/H] = −0.67 ± 0.09 dex from the spectra of 3 M-type supergiants, and with those of Cole et al. (1999) who estimated the [Fe/H] abundance of the blue and red supergiants to be ≤−1.0 dex. Multiple [Fe/H] measurements have also been made of the intermediate- and old-age populations. Based on the average (V − I) colour of the population at the TRGB, Freedman (1988) and Cole et al. (1999) estimated the metallicity of the RGB population to be [ Fe/H ] = −1.30 dex and [ Fe/H ] = −1.40 ± 0.30 dex respectively. These measurements are in good agreement with those of Zucker & Wyder (2004), who find a mean abundance of [Fe/H] = −1.30 dex from the equivalent width of two Ca II triplet lines in the spectra of a sample of RGB stars. Górski et al. (2011) estimated the metallicity of the older RGB population to be [Fe/H] = −1.50 ± 0.08 dex based on their optical colours, while Dolphin et al. (2001) quote a more metal rich value of [ Fe/H ] = −1.15 ± 0.20 dex based on the interpolation of the isochrones by Girardi et al. (2000). For the RR Lyrae population (>10 Gyr) Dolphin et al. (2001) estimate a mean metallicity of [Fe/H] = −1.30 ± 0.2 dex. This is more metal rich than other estimates by Tikhonov & Galazutdinova (2002) and Cole et al. (1999) who estimate the metallicity of the old population to be [ Fe/H ] = −1.75 ± 0.20 and [ Fe/H ] = −1.80 to − 2.0 dex respectively, based on optical photometry of the giant population. We will examine the intermediate age (1−10 Gyr) AGB population and derive its metallicity using JHK photometry and the C/M ratio.
During the thermally pulsing AGB (TP-AGB) phase, mixing mechanisms can dredge up triple-α processed material from the He-burning shell to the stellar atmosphere. The dredged up material can cause the dominant metal in the atmosphere to change from oxygen to carbon. Sources which have more oxygen than carbon (C/O < 1) in their atmospheres are known as oxygen-rich or M-type, while those that have more carbon than oxygen (C/M > 1) are known as carbon-rich or C-type. The ratio between the number of C- and the number of M-type stars is known as the C/M ratio. This ratio is often used as an indirect indicator of metallicity in the environment in which those stars formed, as at lower metallicities the transformation from an initially O-rich atmosphere to a C-rich one is easier as fewer dredge-up events are required (Iben & Renzini 1983; Blanco et al. 1978).
The structure of this paper is as follows. In Sect. 2 we present our data and the selection of sources for our analysis, in Sects. 3 and 4 we analyse the data and present out results, followed by a discussion and our conclusions in Sects. 5 and 6.
2. Observations and data reduction
2.1. JHK photometry
Images of IC 1613, centered on α = 01h04m54s,δ = 02°07′57.4′′ were obtained as part of a larger project to survey the AGB population of Local Group galaxies (PI Irwin). Using the Wide Field CAMera (WFCAM) mounted on UKIRT in Hawai’i on the night of the 5 August 2008, images were obtained in the near-infrared (NIR) bands J,H and K covering an area of 0.80 deg2 on the sky. The total exposure time per pixel for each band was 200s from the co-addition of 4 frames each taken using a dithered pattern of 5 positions with an exposure time of 10 s in each position. The average seeing on the night of the observations was 0.64′′.
The data are similar to those used by Sibbons et al. (2012) to investigate the AGB population of the LG dIrr NGC 6822. Details of the reduction and calibration of the photometry using the 2MASS point source catalogue are as given by Sibbons et al. (2012). The magnitudes and colours given here are on the WFCAM instrumental system (see Hodgkin et al. 2009 for transformations) and have been corrected for foreground reddening in the direction of IC 1613 using the extinction map of Schlegel et al. (1998), which gives E(B − V) = 0.02−0.03 mag. Internal obscuration in IC 1613 is also low, estimated to be between E(B − V) = 0.06 ± 0.02 and 0.09 ± 0.019 (Georgiev et al. 1999; Pietrzyński et al. 2006) in the dusty star forming regions of the galaxy. No correction has been made to account for internal reddening in the galaxy but as the effects of reddening are reduced in the NIR (E(J − K) = 0.010−0.015 mag) the impact on our results is expected to be negligible. All magnitudes and colours are presented in their dereddened (foreground only) form.
In Fig. 1 we present the magnitude distribution of our sources in all three bands and a synthetic foreground generated (in the K-band) using the TRILEGAL code (Girardi et al. 2005). The real and the synthetic data have similar bright-star distributions, until ~17−18 mag in the J0-, H0- and K0-bands where they begin to diverge. The synthetic population (which is assumed to be complete) becomes flatter at K ≳ 18 mag before starting to gradually decline at K ~ 22 mag. The number of sources we detect however steadily increases fainter than K0 ~ 17−18 mag, where AGB stars in IC 1613 are detected, before showing a distinct discontinuity at J0 ~ 19.20 mag, H0 ~ 18.40 mag and K0 ~ 18.20 mag reflecting a further increase in the number of sources at around the magnitude of the TRGB. The presence of giants in IC 1613 is more obvious than it was in the case of NGC 6822 (Sibbons et al. 2012, their Fig. 3) due to the much lower foreground contamination in the direction of IC 1613 (l= 129°.74, b=−60°.58) compared to NGC 6822 (l = 25°.34, b =−18°.39). These approximate TRGB values are supported by the values published by Górski et al. (2011) (JTRGB = 19.19 ± 0.08 mag, KTRGB = 18.13 ± 0.08 mag) and by Jung et al. (2009) (JTRGB = 19.10 mag, HTRGB = 18.40 mag, KsTRGB = 18.0 mag). Our estimate of the TRGB magnitude is refined in Sect. 3.2.
The completeness of our data in each band was also inferred from Fig. 1. As noted above, the synthetic distribution begins to decline at K ~ 22.0 mag; this decline is attributed to a change in the MW population – possibly the edge of the disk. For our JHK data we see a sharp decline at much brighter magnitudes, which we attribute to the declining completeness of the data. The data are assumed to be complete until the peak of the distribution in each band, 19.7,19.3 and 18.9 mag in J0,H0 and K0 respectively. Beyond this, we approximate the completeness level by normalising to the observed star count at the peak of each band using this computational convenience. The completeness level in each band falls to the 50% level at around 20.6 mag in J0, 19.8 mag in H0 and 19.4 mag in K0. The data are therefore sufficiently complete for our intended study of the AGB population based on the estimated position of the TRGB discussed above.
2.2. Source selection
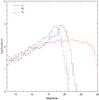 |
Fig. 1 Log number vs. linear magnitude in 0.2 mag bins. The red line shows the magnitude distribution of the TRILEGAL synthesised foreground population in the K-band. |
From the raw images, a catalogue of ~27 700 sources was derived. Each source was assigned a flag depending on the quality of the data in each photometric band. Sources were flagged as: saturated, noise-like, non-stellar, probably-stellar, stellar, compact non-stellar or poor astrometry match. In our analysis of a similar data set for NGC 6822 we selected only those sources flagged as stellar or probably-stellar in all three bands. However, spectroscopic follow up (Sibbons et al. 2014) has led us to relax this criterion as it results in the rejection of many genuine stellar sources. If only those sources meeting the stringent three flag criterion are selected, the number of sources in our primary photometric sample is reduced to 4858. If the more relaxed two flag criterion is applied, in which we require only two bands to have a stellar or probably-stellar flag, but still require a magnitude measurement in all three photometric bands, a photometric sample of 7008 sources is obtained.
By selecting sources that have been classified as stellar or probably stellar in at least two bands, we ensure that we obtain a larger sample, but are still able to exclude potential contamination from background galaxies, which are likely to have a non-stellar classification. The potential extent of the contamination from these background sources is demonstrated in Fig. 2 where we present two (J − K, K) CMDs. The first of these shows a sample of sources that have been classified as non-stellar in both the J- and K-bands, while the second shows those sources that have been retained using the two band and three band flag criterion used to select our sample. If our two flag criterion was relaxed further (e.g. to only one flag) the potential contamination from non-stellar sources, particularly at redder (J − K) colours, would be significant.
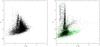 |
Fig. 2 Left: colour−magnitude diagram of those sources with a non-stellar classification in both the J- and K-bands. Right: colour−magnitude diagram of those sources that have been selected using the flag criteria discussed in the text. Sources in black are those that meet the three band flag criteria. Sources in green are those that meet the two band flag criteria. |
In order to confirm that the additional sources retained using the two flag criterion are of comparable quality to those retained using the three flag criteria, we plot the error on the photometric measurement for each source in each band in Fig. 3. The additional sources selected using the two flag criterion show a similar error distribution to those selected using the three flag criteria and therefore do not lower the overall quality of our photometric sample. The increase in error at fainter magnitudes is typical of photometric measurements. We will therefore apply the two flag criterion and retain the larger photometric sample for our analysis.
3. Analysis
3.1. Foreground and K-giant removal
The high galactic latitude of IC 1613 means that it does not suffer from high levels of foreground contamination along the line of sight. Nevertheless, any foreground stars in our photometric sample must be removed before we can isolate the AGB population of IC 1613. The schematic diagram of Bessell & Brett (1988, Fig. A3) shows that a (H − K,J − H) colour−colour diagram can be employed to separate K- and M-type dwarf sources from C- and M-type giants, as they diverge in (J − H). To establish the appropriate selection criteria, relatively uncontaminated samples of the galactic and foreground populations are needed for comparison.
To achieve this, the observed area has been subdivided into smaller regions (Fig. 4) of ~10′ × 10′. Although the central grid square will still be contaminated by foreground sources, the low density in the direction of IC 1613 and the high proportion of the galaxy contained in this part of the grid means that the level of contamination is not likely to be significant, and the colour distribution of these sources should primarily reflect that of the IC 1613 giants. In the grid corners the opposite is expected to be true. Although sources identified as belonging to IC 1613 have been traced out to a radius of ~23′ (Battinelli et al. 2007a), the corner grid regions lie well beyond that at 30′ and the colour distribution of sources in these regions should give a good indication of the colours of the foreground sources. It was decided to combine the sources from the four corner squares as a representative sample of the MW foreground. A two-colour plot comparing the corner sources with those in the central region can be seen in the left panel of Fig. 5. Only sources with a photometric error (σJ,H,K< 0.1 mag) have been plotted in Fig. 5 to better show the underlying distribution. Although there is some scatter, the distribution of the foreground sources mirrors that of the dwarf and K-type sources in the Bessell & Brett (1988) schematic and there is a clear separation between the foreground and IC 1613 sources at (J − H)0 ~ 0.65 mag. A (J − H) colour histogram, shown in the right hand panel of Fig. 5 is used to refine the position of this colour boundary and shows that the number of sources in the corner grid regions declines sharply at (J − H)0< 0.64 mag. This cut is also in good agreement with the (J − H) colours of the TRILEGAL synthesised foreground, 95% of which have colours bluer than (J − H)0 = 0.64 mag.
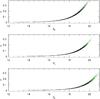 |
Fig. 3 Error vs. magnitude for each photometric band. In black are sources that have been classified as stellar or probably-stellar in all three photometric bands. In green are the additional sources that have been classified as stellar or probably stellar in only two photometric bands. |
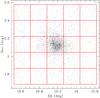 |
Fig. 4 Observed area subdivided into a grid of 25 squares each with dimensions of ~10′ × 10′. The high density of sources in the centre is IC 1613. |
A colour cut of (J − H)0 = 0.64 mag is therefore used to remove the bulk of the foreground sources from our photometric sample. However, as discussed in our previous and forthcoming work (Sibbons et al. 2012, 2014) such a colour criterion is imperfect. As can be seen in the right hand panel of Fig. 5, the colour distribution of the assumed foreground sources extends to redder (J − H) colours than the cut off being applied here, and some foreground contaminants will inevitably be retained. It is also true that some genuine IC 1613 sources with bluer (J − H) colours, in particular many K-type giants, will be removed by the application of this colour criterion, we discuss this in Sect. 4.2.1.
We can make an estimate of the remaining foreground contamination. Proceeding under the assumption that the sources in the outer grid regions with colours of (J − H)0 ≥ 0.64 mag are all foreground sources and that their redder colours are within the normal range for the foreground population (TRILEGAL synthesised foreground colours in (J − H)0 can be as red as 1.36 mag); although some may be genuine IC 1613 sources, the number is not likely to be high and we have no way to distinguish them from the foreground sources at this time. Of the 451 sources that make up the foreground sample, 69 (15%) have colours that are redder than our foreground cut, suggesting the central grid contains approximately 17 MW foreground stars after the (J − H) cut has been applied. Fig. 6 shows the CMD of the foreground “cleaned” central region and those sources from the corner regions that have colours (J − H)0 ≥ 0.64 mag, approximately 70% of which are fainter than the TRGB (Sect. 3.2).
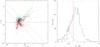 |
Fig. 5 Left: colour−colour diagram of sources from the centre of the observed area which is dominated by IC 1613 sources (black crosses) and sources from the four corner regions of the grid (red crosses) where MW sources are expected to dominate. Only sources with σJ,H,K< 0.1 mag have been shown. The dashed horizontal line at (J − H)0 = 0.64 mag is the primary foreground removal cutoff applied to our sample. The dashed diagonal lines at (J − K)0 = 0.75 and 1.15 mag are the colour criteria used for the selection of C- and M-type AGB candidates (Sect. 3.3). The solid green line shows the trend identified by Whitelock et al. (2006) for Galactic and LMC C-type Mira. Right: a (J − H) colour histogram of the same sources, with bin size 0.02 mag. The solid line histogram represents those sources from the central region, the dashed line represents the corner region sources over an area four times larger than the central region. The solid red line is at (J − H)0 = 0.64 mag. |
A second colour cut in (J − K) was considered to remove those foreground sources with colours (J − H)0 ≥ 0.64 mag. However, any cut in (J − K) to remove a significant number of these remaining dwarf sources was found to have a far greater impact on the number of potential M-type giants and it was therefore decided not to proceed with such a cut. We estimate a remaining foreground contamination level of approx. 5 AGB stars per grid region or ~0.8 stars per kpc2, brighter than the TRGB, if IC 1613 is inclined at 38° (Lake & Skillman 1989). We expect a residual foreground density of <1% among the AGB sources retained in the central region, though this percentage will increase with radial distance from the galactic centre as the stellar density declines.
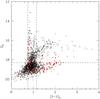 |
Fig. 6 Colour−magnitude diagram of sources from the central grid region (black crosses) and from the four corner regions (red triangles) with (J − H)0 ≥ 0.64. The dashed horizontal line marks the position of the TRGB at K = 18.28 mag (Sect. 3.2). The dashed vertical lines mark the positions of the blue limit (left) and the boundary between the C- and M-type stars (right) (see Sect. 3.3). |
We have concentrated here on the removal of foreground dwarfs from our photometric sample as foreground giant sources are expected to be so bright that they will have been removed as saturated sources (K0< 13.55 mag) by our flag criteria. This is consistent with the right hand panel of Fig. 2, where among the sources included in our photometric sample as a result of using the two-band flag criteria we see a trail of very bright (K0< 13.5 mag) sources blueward of (J − K)0 = 0.80 mag. An examination of the flag classifications of these sources shows that with one exception they have all been classified as saturated in their “non-stellar” band. However, any impact on our final giant sample will be negligible as >91% of these potential foreground giant sources have been removed with the application of the blue colour limit at (J − K)0 = 0.75 mag (see Sect. 3.3.2).
While our use of the NIR colour−colour diagram has focused on the removal of contaminants from our sample, the same diagram has been used by others to classify AGB and RGB sources as either C- or M-type. Based on the schematic of Bessell & Brett (1988) the large clump of IC 1613 sources located at (H − K)0 ~ 0.15 mag are likely to be M-type AGB and RGB stars, while the extended tail of sources at redder (H − K) and (J − H) colours follows the same trend identified Whitelock et al. (2006) for Galactic and Large Magellanic Cloud (LMC) C-type Miras (Fig. 5). During their work on the dwarf spheroidal galaxies Leo II and Leo I, Gullieuszik et al. (2008) and Held et al. (2010) used this colour−colour diagram to classify the AGB stars in their respective samples as C- or M-type. However, the larger photometric errors in our data compared to those of Gullieuszik et al. (2008) and Held et al. (2010), as well the indistinct colour boundary between the two populations in our sample, mean that we are unable to employ the same technique. Instead we have relied on a (J − K,K) CMD to distinguish between the two spectral types as we discuss in Sect. 3.3.
3.2. Tip of the RGB
The AGB population is isolated using a magnitude cut at the tip of the red giant branch. The TRGB is one of the most prominent features in the magnitude distribution of old- and intermediate-age populations. The onset of He burning in stars ascending the RGB results in a striking discontinuity in the magnitude distribution at the TRGB, as the number of sources at brighter magnitudes (on the AGB) falls off sharply in comparison with the number of sources at fainter magnitudes (on the RGB) due to a difference in the evolutionary timescales of the two phases.
The position of the TRGB has been located by applying the Sobel edge detection algorithm (Lee et al. 1993) to a smoothed magnitude distribution using the modified method of Sakai et al. (1996). The Sobel algorithm is a first derivative operator that computes the rate of change (gradient) across an edge, producing a peak where there is a significant change of slope. Due to the sharp discontinuity in the magnitude distribution around the TRGB, the largest peak produced by the filter is expected to be located at the TRGB. A Gaussian is then fitted to this peak to establish the magnitude and associated error of the TRGB. However, in order to accurately apply the Sobel filter, it is necessary that the population being examined is sufficiently large that there are at least 100 sources in the range extending one magnitude fainter than the TRGB (Madore & Freedman 1995; Bellazzini et al. 2002). To ensure that this requirement is met, the Sobel filter is initially applied to the central grid region in Fig. 4 as it has the highest density of sources. After the colour criterion discussed in Sect. 3.1 have been applied, there are over 1000 sources with K0> 18.0 mag. This should be sufficient to ensure that the Sobel filter can be reliably applied.
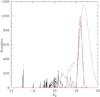 |
Fig. 7 Smoothed K-band magnitude distribution (dashed line) of the sources in the ~10′ × 10′ central grid region. The Sobel filter (solid black line) has been applied and a Gaussian curve (solid red line) has been fitted to the strongest peak to determine the position of the TRGB magnitude and the associated error. The distribution is a generalised histogram and the vertical scale is arbitrary. |
Using the method described we locate the TRGB at K0 = 18.37 ± 0.15 mag. However, Cioni et al. (2000) found the Sobel filter to be systematically biased towards fainter magnitudes, due to the effects of smoothing the data. Magnitude corrections were supplied by the same authors and have been applied here, giving a revised TRGB magnitude of K0 = 18.28 ± 0.15 mag. This is in reasonable agreement, within errors, with previous measurements of the TRGB (e.g. Górski et al. 2011). The derived TRGB value is also consistent with the position of the discontinuity seen in the K-band magnitude distribution presented in Fig. 1.
We discuss the variation of the TRGB magnitude across the face of IC 1613 in Sect. 4, but for the purposes of isolating AGB sources in our photometric sample we use a magnitude cut at K0 = 18.28 mag.
3.3. Colour selection
3.3.1. C- and M-type AGB stars
After isolating the AGB sources, it is necessary to classify them as either C- or M-type before an estimate of the C/M ratio can be made. C- and M-type stars can be identified by their position in the (J − K, K) CMD. M-type stars follow a vertical sequence above the TRGB extending to brighter magnitudes over a relatively narrow range of (J − K) colours. On the other hand, C-type stars display a wider range of colours which at (J − K)0 ~ 1 mag overlap with, and at (J − K)0 ≥ 1.2 mag extend redder than, the M-type stars. In both Figs. 5 and 6, C-type stars result in an extended diagonal sequence (depending on the scale of the axis). The separation between the two sequences becomes more apparent at brighter magnitudes, however at magnitudes <1 mag brighter than the TRGB there is significant overlap between the two spectral types, as can be seen in Fig. 6.
From Fig. 6, the colour separation between the C- and M-type stars can be estimated to lie between (J − K)0 = 1.10 − 1.20 mag. This estimate is refined using a (J − K) colour histogram of the AGB sources in the central grid region (Fig. 8). Due to the concentration of the M-type sources over a narrow range of colours in comparison with the wider colour distribution of the C-type population, the separation between the two spectral types is marked by a discontinuity in the (J − K) histogram. The strong peak in Fig. 8 identifies the M-type population followed by a sudden decline in the number of sources and a tail extending to redder (J − K) colours due to the C-type population. The colour separation was found to lie at (J − K)0 = 1.15 ± 0.05 mag. For the purposes of comparison with other studies, this translates into a colour separation of (J − Ks)2MASS ~ 1.22 mag on the 2MASS system using the transformations of Carpenter (2001).
This value has been used for the purposes of classifying candidate C- and M-type AGB stars in our photometric sample. However, as was noted by Battinelli & Demers (2009) and Sibbons et al. (2014), there is no strict colour boundary between these two spectral types in (J − K) and the misclassification of AGB sources in both directions is probable. Their broad range of colours means that C-type stars in particular are likely to be seen on either side of this colour boundary and the cut at (J − K)0 = 1.15 mag may well represent the red limit for the majority of the M-type population rather better than the blue limit for the C-type population (Kacharov et al. 2012; Sibbons et al. 2014). Although in rare cases very M-type stars with (J − K) colours much redder than this have been found (Woods et al. 2011), such a colour cut is appropriate for an initial estimate of the global C/M ratio, as is the aim of this work. Spectroscopic data would be required in order to refine the classification of individual stars.
In their study of IC 1613, Battinelli & Demers (2009) conclude that a cut at (J − Ks) = 1.40 mag would provide a reliable sample of C-type stars. From Fig. 8 we agree that a cut around (J − K)0 ~ 1.30 mag would provide the purest sample of C-type stars, but it would also exclude a large number of bluer C-type stars and so would not be appropriate for our purposes.
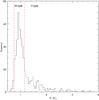 |
Fig. 8 (J-K) colour histogram of those sources in the central grid region (Fig. 4) with (J − H)0 ≥ 0.64 mag and brighter than the TRGB magnitude. The vertical dashed lines mark the position of the colour separation imposed here to distinguish between C- and M-type sources at (J − K)0 = 1.15 ± 0.05 mag and the blue limit at (J − K)0 = 0.75 mag (see Sect. 3.3.2). |
3.3.2. Blue limit to M-type giants
After the application of the (J − H) foreground cut, those sources brighter than the TRGB span a (J − K)0 colour range of 0.47 − 4.18 mag (Fig. 8). It is unlikely that the M-type AGB sources would extend to such blue colours and it was therefore decided to apply a “blue limit” to exclude contamination from K-type giants (Bessell & Brett 1988; Battinelli et al. 2007b). From Fig. 8 this limit is placed empirically at (J − K)0 = 0.75 mag where we see a significant increase in the number of sources contributing to the peak of what we believe to be M-type AGB stars. Based on our JHK photometric survey of NGC 6822 (Sibbons et al. 2012) and the (J − K) colour distribution of spectroscopically confirmed M-type giants in that galaxy (Kacharov et al. 2012), this increase is expected to coincide with the blue limit of the M-type giant (J − K) colour distribution.
The final criteria used for the selection of AGB candidates in IC 1613 were (J − H)0 ≥ 0.64 mag and K0< 18.28 mag. M-type sources were then selected between 0.75 ≤ (J − K)0< 1.15 mag and C-type sources were selected at (J − K)0 ≥ 1.15 mag. A red (J − K) limit was not applied for the selection of the C-type candidates as these sources have been shown to extend to least (J − K)0 ~ 2.4 mag (Battinelli & Demers 2009) in IC 1613, and the relatively few sources in our C-type sample with colours redder than this may still be genuine AGB stars that are heavily enshrouded by dust (Zijlstra et al. 2006).
4. Results
4.1. AGB catalogues
We present two catalogues: the first, Catalogue 1 (see Table 1) contains the 843 sources that we have classified as C- or M-type AGB stars within 4.5 kpc of the galactic centre. These sources have been classified using the selection criteria derived in Sect. 3 and are the basis for the C/M ratio and [Fe/H] abundance derived below. In Col. 1 we present an identification number for the source followed by its position in Right Ascension (RA) and Declination (Dec) for the equinox J2000, in Cols. 2 and 3. Columns 4 − 6 contain the J0-band magnitude, the associated error and the quality flag classification in that band, the same information is presented in Cols. 7 − 12 for the H0- and K0-bands respectively. Finally in Col. 13 we list the source classification, either C- or M-type. However, based on our findings in Sect. 3.1 and Sect. 4.2.2 its should be noted that this catalogue is likely to contain some foreground sources that have been misclassified as giants.
In Catalogue 2 (Table 2), we present all those sources that met with our flag selection criteria for the full observed area; no other selection criteria have been applied to this catalogue. With the exception of spectral type, the data in each column is the same as for Table 1. The quality flag classifications in Cols. 6,9 and 12 of both tables are as follows; −9: saturated, −8: poor astrometric match, −3: compact non-stellar, −2: probably-stellar, −1: stellar, 0: noise-like and 1: non-stellar.
4.2. Spatial distributions
4.2.1. The removed foreground and K-type giants
In the left panel of Fig. 9 we present a surface density plot of those sources that have been removed using the (J − H) colour criterion. The overdensity in the centre indicates that many genuine IC 1613 sources have been removed by the colour cut. This was expected, as given the overlap in colour between K-type giant and foreground sources (Nikolaev & Weinberg 2000), foreground removal by colour selection will always be imperfect. The question we must address is what impact this will have on the estimated numbers of C- and M-type giants in IC 1613.
In the right panel of Fig. 9 we show a CMD of the sources removed from our data set as foreground. Nearly half of the sources removed lie below the TRGB and so would not contribute to the estimated number of AGB stars, genuine IC 1613 sources in this region of the CMD are probably RGB stars. The majority of the removed sources above the TRGB form a vertical sequence around the blue limit at (J − K)0 = 0.75 mag and are probably K-type giants rather than M-type which tend to have redder colours (see Fig. 6). Based on this CMD, the impact of our foreground cut on the number of C-type sources will be negligible, and while the overlap in colours means that it is inevitable that some M-type giants will be removed with the foreground, the majority of the genuine IC 1613 giant sources removed are thought to be K-type and RGB stars rather than M-type giants. The removal these sources is of no consequence to our work; therefore, although the C/M ratio we derive will be affected by the removal of some genuine M-type giant sources, as well as the inclusion of a small number of IC 1613 K-type giants and foreground contaminants, we do not expect the impact to be severe. However, we do consider the effects of alternative cuts in (J − K) and (J − H) in Sects. 5.3 and 5.4.
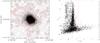 |
Fig. 9 Left: density distribution of the foreground and IC 1613 K-type giant sources removed from the JHK data set as described in Sect. 3.1. Using 1600 bins across the full observed area contours are at 2, 5, 10, 25 and 40 per arcmin2. Right: CMD of all the sources removed as foreground and the K-type giants. The dashed horizontal and vertical lines are the AGB selection criteria discussed in Sect. 3. |
4.2.2. Stellar density profiles
In the top panel of Fig. 10 we show the spatial distribution of the AGB candidates we have identified. There is a clear overdensity in the centre, with the number of sources declining with distance from the galactic centre. Sources in the outer part of the galaxy may be genuine AGB sources or they may be residual foreground contamination within our sample, estimated in Sect. 3.1 as ~0.8 stars per kpc2. In order to examine the distribution of our candidate sources in more detail and to make a second estimate of the level of remaining foreground contamination in our sample, we plot the density of candidate sources per kpc2 as a function of distance from the galactic centre.
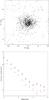 |
Fig. 10 Top: spatial distribution of the candidate AGB stars in the observed area. Bottom: Log plot of the number of AGB (red triangles) and RGB (black dots) classified sources per kpc2 as a function of distance from the galactic centre. The dashed line at − 0.086 indicates the residual background level brighter than the TRGB, estimated from the four corners of the grid (see Sect. 3.2). |
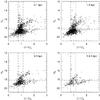 |
Fig. 11 Colour−magnitude diagrams of those sources with (J − H)0 ≥ 0.64 mag within each of the annuli between 0 − 1 kpc, 1 − 2 kpc, 2 − 3 kpc and 3 − 4.5 kpc. Foreground stars with (J − H)0 ≥ 0.64 mag will also be present. The dashed horizontal and vertical lines mark the position of the TRGB and our (J − K) classification criteria respectively. |
As IC 1613 is inclined to the line of sight, we first deproject the sources on to a flat plane using a position angle (PA) of 58° and an inclination of i= 38°, as calculated by Lake & Skillman (1989) based on the H I distribution of the galaxy. The distance in kpc from the galactic centre in the plane of the galactic disk is then calculated for every source. The number of RGB and AGB sources is then calculated in 12 annuli at intervals of 0.5 kpc between 0 − 6 kpc from the centre of the galaxy. The results are presented in the bottom panel of Fig. 10. We limit our outer-most annulus to 6 kpc (~27′), as based on estimates of the tidal radius of IC 1613 by Hodge et al. (1991) and Battinelli et al. (2007a) no significant number of stellar sources are expected beyond this.
In Fig. 10 we see a steep decline in the number of AGB sources out to ~4 − 4.5 kpc before the profile levels off between ~4 − 6 kpc. The RGB density profile shows similar behaviour. A distance of 4 − 4.5 kpc from the galactic centre translates into an angular distance of 18 − 20′ at a distance of 758 kpc. These measurements are consistent with previous estimates by Bernard et al. (2007) who report the detection of RGB stars out to r> 16.5′ and Battinelli et al. (2007a) who found that the density profile of giant stars, mainly on the RGB, declined to zero at r ~ 23′. Battinelli et al. (2007a) also confirmed the findings of Tikhonov & Galazutdinova (2002) that no giants belonging to IC 1613 are seen in the HST archive images at 27′ and 33′, ~6 and ~7 kpc respectively. This suggests that the AGB profile in Fig. 10 is declining as it approaches the edge of the galaxy and that beyond ~4 − 4.5 kpc the candidate AGB sources we detect have a high probability of being foreground interlopers. The level of AGB contamination inferred from Fig. 10 is consistent with that inferred from the grid corners in Sect. 3.2.
In Fig. 11 we present four CMDs of the sources between 0−1 kpc, 1−2 kpc, 2−3 kpc and 3−4.5 kpc. Beyond 3 kpc the vertical sequence defined by the M-type stars is no longer visible and the C-type branch is much weaker. This supports our earlier conclusions about the decreasing stellar density approaching 4.5 kpc. We therefore limit our selection of AGB stars in IC 1613 to within 4.5 kpc of the galactic centre. The number of candidate AGB C- and M-type stars per kpc2 beyond this limit has then been used to make an estimate of the number of remaining foreground contaminants in our sample before making a final estimate of the C/M ratio in Sect. 4.4.
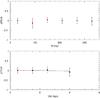 |
Fig. 12 Variation of TRGB magnitude as a function of azimuthal angle (top) and as a function of distance from the galactic centre (bottom). In the top panel, the TRGB measurements from only the six inner segments seen in Fig. 13 are shown. In the bottom panel the solid black line shows a weighted linear fit to all the data points, the dashed red line shows a weighted fit to only the first 3 data points. |
4.3. The TRGB
The TRGB has been shown to be sensitive to both age and metallicity, becoming brighter in older sources within a population of a single metallicity but moving to fainter magnitudes with decreasing metallicity in a population of a single age. In a galaxy such as IC 1613 which has undergone continuous star formation the opposing effects of these population characteristics can make it difficult to interpret any change in the measured TRGB magnitude (Salaris & Girardi 2005), however in conjunction with the derived [Fe/H] abundance below, any variation in the TRGB may help us to better understand the age and metallicity distribution of the giant population in IC 1613.
In Sect. 3 the TRGB was found to be K = 18.28 ± 0.15 mag. The area within the 4.5 kpc limit was subdivided into 4 annuli between 0−1 kpc, 1−2 kpc, 2−3 kpc and 3−4.5 kpc to establish if there is any variation in the TRGB with increasing distance from the galactic centre. The final annuli has a larger radius to ensure that the criteria for the reliable application of the Sobel filter were met (Sect. 3.2). The results of these measurements are shown in the bottom panel of Fig. 12 which gives ΔTRGB = KTRGB−18.28. As can been seen, there is very little variation in the measured TRGB with distance from the galactic centre. Overall there is a spread of ΔK0 = 0.11 mag, however if the last data point, which had only 136 sources in the magnitude range K0> 18.0 mag, is excluded this spread is reduced to ΔK0 = 0.03 mag. An error weighted fit to all of the data points shows a shallow negative slope (ΔTRGB = −0.01( ± 0.02) × d + 0.01( ± 0.04)), where d is the galactocentric distance in kpc. This suggests that the TRGB magnitude increases with distance from the galactic centre but at the level of only 0.5σ, i.e. such that we can not conclude that the TRGB is varying with distance.
In addition to the 4 annuli described above, the area within 4.5 kpc was separately divided into 12 segments, 6 between 0−2 kpc and 6 between 2−4.5 kpc each with a separation of 60° (see Fig. 13), in order to study the TRGB as a function of azimuthal angle. The measured TRGB magnitudes in the 6 inner segments are presented in the top panel of Fig. 12. The outer segments unfortunately did not have enough sources with magnitude K0> 18.0 mag for the reliable application of the Sobel filter. Overall there was a spread of ΔK0 = 0.17 mag in the measured TRGB in the 6 segments but as can be seen in Fig. 12 there is no overall trend in the TRGB and the average value of K0 = 18.25 ± 0.07 mag is in excellent agreement with the TRGB magnitude we use for the selection of AGB sources.
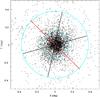 |
Fig. 13 Observed area has been aligned with the PA (58°) of the galactic H I and de-projected using an inclination of 38°. The black crosses show the positions of those sources with (J − H)0 ≥ 0.64 mag. Two circles at radius 2 kpc (9′) and 4.5 kpc (20′) have been imposed and the area divided into 6 segments in each annuli order to examine the TRGB, C/M ratio and [Fe/H] abundance within IC 1613 as a function of angle. The thick red line marks the approximate position of the PA in the de-projected image. |
4.4. The C/M ratio
Within 4.5 kpc of the galactic centre of IC 1613 (in the de-projected plane), from 291 C-type and 552 M-type AGB stars we infer C/M = 0.53 ± 0.04. This value is calculated without any adjustment for the remaining foreground contamination, which from the number of C- and M-type classified stars we find beyond 4.5 kpc we calculate to be ~0.28 C-type and ~0.41 M-type sources per kpc2. However, the low level of foreground contamination in the direction IC 1613 means that if a statistical adjustment is made to account for the remaining contaminants, it has very little impact on the derived C/M ratio which becomes 0.52 ± 0.04. Using the C/M vs. [Fe/H] relation of Cioni (2009) ([Fe/H] = −1.39 ± 0.06 − (0.47 ± 0.10)log(C/M)) we derive a global [Fe/H] abundance of −1.26 ± 0.07 dex.
The same 4 annuli between 0−4.5 kpc and the same 12 segments shown in Fig. 13 that were used in Sect. 4.3, have also been used to study the C/M ratio and the [Fe/H] abundance as a function of radial distance and azimuthal angle. Our results are presented in Fig. 14. In the bottom left panel of Fig. 14 we see a spread of 0.18 in the C/M ratio out to a radius of 4.5 kpc. A weighted fit to the data (Δ(C/M) = 0.04( ± 0.04) × d + 0.45( ± 0.05)) shows a shallow trend towards a greater value of C/M (i.e. lower metallicity) with increasing distance from the galactic centre but of only 1σ significance. The spread in C/M translates into [Fe/H] between − 1.23 and − 1.30 dex. However, a weighted fit to all of the data points (Δ [ Fe/H ] = −0.02( ± 0.02) × d − 1.23( ± 0.03)) does not suggest a strong trend to lower metallicities with increasing galactocentric distance.
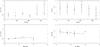 |
Fig. 14 Top left panel: C/M ratio as a function of azimuthal angle for each of the segments shown in Fig. 13. The inner segments, 0−2 kpc (red squares), and the outer segments 2−4.5 kpc (black triangles) are shown separately. Bottom panel: C/M ratio as a function of distance from the galactic centre. The solid black line is a weighted linear fit to all four points, the red dashed line is also weighted but is only fitted to the first three points. Right: the same information is presented in the right hand panels for the [Fe/H] abundance, derived from the C/M ratio using the relation of Cioni (2009). |
The variation in the calculated C/M ratio and the [Fe/H] abundance as a function of azimuthal angle for each segment in Fig. 13 are shown in the top panels of Fig. 14. The angle is measured anti-clockwise from the PA (58°) of the galaxy. The measurements for the inner segments between 0−2 kpc are shown by the red squares and those for the outer segments between 2−4.5 kpc are shown by the black triangles. A spread of Δ(C/M) = 0.20 is seen in the measurements from the inner segments while a much larger spread of Δ(C/M) = 1.27 is seen in the measurements from the outer segments, however the statistical errors on the outer segments are large. We therefore restrict our analysis to the more reliable inner segment measurements. The measured C/M seems to show a slight sinusoidal variation with angle around the galaxy. The variation in C/M in the inner segments translates into a spread of Δ[Fe/H] = 0.09 dex, and as shown in the top right panel of Fig. 14, the derived [Fe/H] values reflect the sinusoidal variation of the C/M ratio although any fit to the data would have a very small amplitude and would not represent a significant variation in metallicity as a function of angle.
5. Discussion
5.1. The C/M ratio: age-metallicity dependence
The analysis in Sect. 3 has been conducted with the aim of isolating and classifying the AGB population of IC 1613 in order to derive the global metallicity of the galaxy using the C/M ratio, as we have done in Sect. 4. This reflects a traditional interpretation of the relationship between the C/M ratio and the metallicity of the interstellar medium, that while sufficient for our purpose of providing an overview of the galactic metallicity distribution, is ultimately too simplistic. In Sibbons et al. (2012, Sect. 4.1.1) we provided a detailed discussion of the importance of population age when interpreting the C/M ratio and some important results in the literature at the time of publication. We briefly summarise that discussion here and provide an overview of other recent results that aim to further constrain our understanding of the TP-AGB phase.
As we outlined in Sect. 1 the creation of intrinsic C-type stars during the TP-AGB phase results from the dredging-up of material, primarily 12C, from the inter-shell region to the surface. This process, known as the third dredge-up (TDU), the subsequent changes in the molecular opacity of the stellar atmosphere and the resulting change in the rate of mass loss, as well as other processes such as hot bottom burning (HBB), are believed to severely limit the mass, and therefore age, range over which C-type AGB stars can form (Mouhcine & Lançon 2003; Girardi et al. 2010; Held et al. 2010). Several observational and theoretical studies have attempted to place constraints on this mass (age) range for different populations. Using detailed stellar models with a range of metallicities (Z = 0.004,0.008,0.02) Karakas (2003) concluded that only stars more massive than 1−1.5 M⊙ will undergo TDU and hence could become C-type stars. Girardi et al. (2010) obtained similar results for even more metal poor stars (Z = 0.001) using their own models and calibrating the TP-AGB tracks against HST observations of AGB stars in nearby galaxies. Kalirai et al. (2014) also used theoretical models calibrated on observational data to examine the evolution of TP-AGB stars at solar metallicity and concluded that the TDU will only occur in stars with an initial mass of ≥2 M⊙. Importantly, they also concluded that at this metallicity the fraction of the TP-AGB lifetime spent as a C-type star is at a maximum for stars with an initial mass of 2.6 M⊙ but still only accounts of ~23% of the time spent in that phase of evolution. Ventura et al. (2012) were able to put an upper limit on the mass range over which C-type stars would form; following the evolution of stars with initial mass 1−8 M⊙ and metallicity Z = 0.008 through the TP-AGB phase, they concluded that only stars with an initial mass of ≤3.5 M⊙ would become C-rich. This result is consistent with the earlier findings of Ventura & Marigo (2010), who reached the same conclusion for stars with a metallicity of Z = 0.001. However, Fishlock et al. (2014) found that depending on the treatment of molecular opacity with successive dredge-up events stars with an initial mass of 5−6 M⊙ and metallicity Z = 0.001 can achieve an atmospheric C/O ratio of greater than unity. While even stars with significantly higher metallicity (Z = 0.02) and initial mass 5 M⊙ can attain a surface C/O ratio that approaches, although never achieves, unity. Boyer et al. (2013) were able to put a metallicity ceiling on the formation of C-type stars. During a trial of a new tool for the detection of C- and M-type stars, Boyer et al. (2013) found only one C-type star in a small field near the centre of M 31, a result which they attributed to the relatively high metallicity ([ M/H ] ~ 0.1 dex) of that region.
The dependence of the C/M ratio on the age, as well as the metallicity, of the population and the anti-correlation between these two characteristics can significantly complicate the interpretation of the measured C/M ratio. For example, following conventional wisdom a “young” AGB population (e.g. ≤4 Gyr) is expected to be more metal rich than an older AGB population (e.g. ≥6 Gyr) in the same galaxy (assuming efficient interstellar mixing), and this would be reflected in a lower C/M ratio for that population. However, given the limited mass range over which C-type stars are expected to evolve, a higher C/M ratio may in fact be observed in the younger population than in the older population which, although more metal poor, no longer contains any stars of sufficient mass to become C-type stars. The application of the single variable C/M vs. [Fe/H] relations currently available in the literature would, in this instance, lead to the erroneous conclusion that the younger population was more metal poor (e.g. Feast et al. 2010). Useful plots have been presented by Gullieuszik et al. (2008) and Held et al. (2010) clearly demonstrating how the number of C-type stars in a population can change with time, and Cioni et al. (2006) present an instructive plot showing the dependence of the C/M ratio on the age of the underlying population.
The mechanisms we list above and their dependence on mass and metallicity produce the same dependencies in the C/M ratio. Unfortunately, they are also among the most poorly understood mechanisms of the AGB phase. At present there is no calibration of the C/M vs. [Fe/H] relation, that we are aware of, that takes the age dependence of the C/M ratio into account. We do not have sufficient data to explore the age and mass distribution of our candidate sources. We have therefore relied on the classical interpretation of the C/M ratio in this work and have brought the age dependence of the C/M ratio to the readers notice to aid in any future reinterpretation of our results. However, we note that the C/M values we obtain with increasing galactic radius are very consistent, showing only a 1σ variation. If a significant age or metallicity gradient were were present with increasing galactic radius we would expect to see a more significant change in the C/M ratio. Otherwise a fine balance between the age and metallicity components of the population would be required to cancel the effect on the C/M ratio.
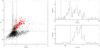 |
Fig. 15 Left: colour−magnitude diagram of all the sources (black crosses) in the original photometric data that met the quality flag criterion and have (J − H)0> 0.64 mag. Plotted as coloured squares are those sources that we have in common with Albert et al. (2000), including those we rejected as foreground or due to the quality of their photometry. Sources classified as AGB are in red, those classified as RGB are in green, those classified as foreground are in yellow and those sources that were rejected by the two-flag quality criteria are in cyan. The dashed horizontal line marks the position of the TRGB and the vertical lines mark the (J − K) selection criteria applied in this work. Right: colour histograms, using 0.02 mag bins, showing the (J − H) and (J − K) colour distributions of those sources we have in common with Albert et al. (2000), all of which they have classified as C-type according to the CN − TiO method. |
5.2. Albert et al. (2000)
Several authors have made use of optical photometry to study the intermediate-age stars in IC 1613 (e.g Freedman 1988; Cole et al. 1999; Tikhonov & Galazutdinova 2002; Battinelli et al. 2007a). One such study by Albert et al. (2000) made use of a multi-filter technique known as the CN − TiO method (Palmer & Wing 1982; Cook et al. 1986) to detect and classify AGB stars in particular. The CN − TiO method relies on two broad-band optical filters and two narrow-band (CN and TiO) filters to classify individual sources and has been shown to be highly successful in the classification of C-type stars in particular (Brewer et al. 1996; Sibbons et al. 2014). Using this method Albert et al. (2000) identified 195 candidate C-type AGB sources in IC 1613, within the 4.5 kpc limit we have imposed and estimated the global C/M ratio in the galaxy to be 0.64.
However, although optical studies have successfully detected AGB stars it has been noted by Brewer et al. (1995) and Groenewegen et al. (2009) that as the environment around an AGB star becomes increasing polluted by dust, the shift in its spectral energy distribution means it can go undetected at optical wavelengths. This can be a problem for C-type stars in particular leading to higher levels of incompleteness for these stars. The problem of detecting AGB stars at optical wavelengths in IC 1613 was clearly demonstrated by Jackson et al. (2007b), in one of a series of papers that used images taken by the Spitzer Infrared Camera Array (IRAC) to conduct a census of AGB stars in LG dIrr galaxies. When comparing their IR data to the optical data of Albert et al. (2000), Jackson et al. (2007b) found that Albert et al. (2000) had detected only 50% of the AGB population. Furthermore, Jackson et al. (2007b) estimated that as Albert et al. (2000) applied a blue limit in (R − I) when selecting AGB candidates they actually used only 18% of the AGB population when calculating the global C/M ratio. The poor AGB detection rate reported for Albert et al. (2000) was repeated when comparing the IRAC data to other optical data sets in IC 1613 and in other dwarf galaxies (Jackson et al. 2007a; Boyer et al. 2009). As a result of the difficult of detecting redder AGB stars at optical wavelengths recent studies (e.g Borissova et al. 2000; Jung et al. 2009) have made use of NIR photometry to detect AGB stars; as these stars emit most of their light at these wavelengths (Frogel et al. 1990) they are among the brightest objects in the NIR.
The NIR data we present here are among the deepest available for IC 1613 and, based on the results of Battinelli et al. (2007a), the field of view covers the whole galaxy. However, as we have demonstrated in Sects. 3 and 4, the selection and classification of AGB sources at NIR wavelengths is not simple and is prone to error at colour and magnitude boundaries. It was decided to cross-match our AGB candidate sources with those of Albert et al. (2000) in order to study the JHK colours and magnitudes of an incomplete but highly reliable C-type star sample and to estimate the potential level of error in our derived C/M ratio.
In order to be considered a reliable match, the sources in our catalogue and those in the catalogue of Albert et al. (2000) must lie within 0.8′′ of each other. We found 145 sources in common with the catalogue of Albert et al. (2000). We have classified 105 (72%) of them as C-type stars. Of the remaining 40 stars, we have classified 25 as M-type AGB stars, 2 as RGB stars, 5 were removed from our sample as foreground stars and 8 were rejected based on the quality of their photometry. We plot the sources common to both samples in Fig. 15, the strong diagonal branch of the C-type giant population is clearly visible, extending blueward of the (J − K)0 = 1.15 mag colour separation we have used for the JHK classification the C- and M-type stars. This is expected, as we foreshadowed in Sect. 3.3.1; the wide colour distribution of C-type AGB stars means that while it is possible to impose a red limit for the classification of M-type AGB stars, it is far more difficult to impose a blue limit on the C-type population. Kacharov et al. (2012), Battinelli & Demers (2009) and Sibbons et al. (2014) have all shown that there is an overlap in (J − K) between the C- and the M-type stars and that no one criterion or set of colour criteria can completely separate the two populations. However, the (J − K) colour distribution in the top right panel of Fig. 15 shows, if we assume the classifications of Albert et al. (2000) are correct, the majority of the C-type sources lie redward of (J − K)0 = 1.15. During their spectroscopic work on AGB stars in NGC 6822 selected using the CN − TiO method, Sibbons et al. (2014) found that JHK misclassifications in the CN − TiO sample were most likely to occur at bluer colours, where the CN − TiO method does not distinguish hotter C-type stars well (Groenewegen 2006; Demers et al. 2006; Letarte et al. 2002). In order to confirm any classification made using JHK or CN − TiO photometry, spectral data are required.
In the bottom right panel of Fig. 15 we show the (J − H) colour distribution of the sources we have in common with Albert et al. the dashed line marks the position of the (J − H) cut used in this work to distinguish between foreground and genuine IC 1613 sources. The majority of the sources classified as C-type by Albert et al. have (J − H)0> 0.64 mag; with only 7 sources having colours bluer than this limit, the (J − H) distribution of these sources strongly supports our choice of foreground colour criteria.
If it is assumed that the classifications of Albert et al. (2000) are correct in all cases, then it suggests that we may have misclassified up to 19% of the genuine C-type stars in IC 1613 as M-type. This would increase the C/M ratio within the central 4.5 kpc to 0.71 ± 0.05 and reduce the derived metallicity to [ Fe/H ] = − 1.32 ± 0.07 dex. However, the work of Sibbons et al. (2014) has shown that a similar catalogue of CN − TiO classified C-type stars in the dwarf galaxy NGC 6822 (Letarte et al. 2002) has overestimated the number of C-type stars by ~7%. If we assumed the same level of error in the classifications of Albert et al. (2000) then the potential number of C-type stars misclassified as M-type in our own AGB sample is reduced to 10%. In this case the C/M ratio in the central 4.5 kpc becomes 0.61 ± 0.04 and the metallicity [ Fe/H ] = − 1.29 ± 0.07 dex.
5.3. J – K blue limit sensitivity
In Sect. 3.3.2, we established a blue limit at (J − K)0 = 0.75 mag to exclude K-type sources from the M-type giant population. In addition to the small leakage of foreground dwarfs into the M-type giant box, evident in Fig. 6, there is a suggestion in Fig. 15 that a noticeable number of K-type giants in IC 1613 have also leaked into the M-type giant selection box. They are suggested by the presence of giants with K0< 17 mag and (J − K)0< 0.9 mag, like those seen in Fig. 9. If these 45 stars are not M-type giants we would need to reduce the M-type giant count in Sect. 4.4 from 552 to 507. This would increase the C/M ratio to 0.57, implying a slightly lower metallicity of [ Fe/H ] = − 1.28 ± 0.07 dex
5.4. J – K sensitivity
In Sect. 3.1 we established a colour cut at (J − H)0 = 0.64 mag to remove the majority of the foreground contamination in our sample. However, it is probable that some genuine IC 1613 giants (mainly M-type giants) were also removed when this colour criterion was applied. We therefore consider if a bluer cut in (J − H) would be more suitable and would preserve more M-type giants (but also admit more K-type giant contaminants). In the right hand panel of Fig. 5 we compared the (J − H) colour distributions of a sample of foreground sources and a sample dominated by genuine IC 1613 sources. The overlap between the two samples is clear, but the foreground dwarf sample declines suddenly at (J − H)0 = 0.58 mag and again at 0.64 mag before tailing off at redder colours, while the IC 1613 sample covers a broader range of colours and peaks between (J − H)0 = 0.7 − 0.9 mag. A colour cut at 0.64 mag was chosen to remove the maximum number of dwarf sources from our sample, however from Fig. 9 we see that a significant number of genuine IC 1613 sources were also eliminated at (J − H)0< 0.64 mag, and we now consider the impact of using a bluer (J − H)0 cut at 0.58 mag, on our derived C/M ratio.
Within the 4.5 kpc radial limit applied in Sect. 4.2.2, we found 291 C-type and 552 M-type AGB stars. With the application of the bluer (J − H) criteria, this becomes 295 C-type and 688 M-type stars, from which we calculate a C/M ratio of 0.43 ± 0.03 and an [Fe/H] abundance of − 1.22 ± 0.08 dex. As we would expect based on the (J − H) distribution of the C-type stars in Fig. 15, the bluer colour cut has far more impact on the number of M-type giants than on the number of C-type giants. This is also reflected in the calculated foreground corrections required when using the bluer (J − H) cut, ~0.31 C-type and ~1.82 M-type stars per kpc2. After making a statistical correction to account for the remaining foreground interlopers the C/M ratio is 0.48 ± 0.04 and [ Fe/H ] = − 1.24 ± 0.07 dex. The [Fe/H] abundance derived using the bluer (J − H) cut is in good agreement with the value we derive in Sect. 4.4 (− 1.26 ± 0.07 dex), and therefore the change in colour cut appears to have had little impact. Using the bluer (J − H) cut means that the number of contaminants remaining in the central grid region increases from 21 to 31 (~1.27 stars per kpc2) but the estimated foreground contamination in the AGB samples is still <1%, although this will increase with radial distance. We prefer to use a foreground colour cut at (J − H)0 = 0.64 mag in order to maintain the purest sample of giants.
5.5. A comparison with NGC 6822
During the JHK photometric and subsequent spectroscopic studies of NGC 6822 (Sibbons et al. 2012, 2014) the following criteria were established for the selection C- and M-type AGB stars: KTRGB = 17.41 ± 0.11 mag, (J − H)0 ≥ 0.76 mag, (J − K)0 ≥ 0.93 mag and a colour of (J − K)0 = 1.17 mag was used to separate the C- and the M-type sources. It is interesting to note that the absolute TRGB magnitude for NGC 6822 (MK = − 6.04 mag) is almost the same as that of IC 1613 (MK = − 6.15 mag), and that the (J − K) colour separation is very similar for both galaxies. Based on the C/M ratio of NGC 6822, the global metallicity of that AGB population was found to be [ Fe/H ] − 1.38 ± 0.06 dex (following our spectroscopic study).
Given the agreement between the calculate metallicities for NGC 6822 and IC 1613, variations in the TRGB magnitude of each galaxy may be used to compare the relative ages of the AGB populations in the two galaxies. The close agreement between the absolute magnitude of the TRGB in IC 1613 and in NGC 6822 suggests that the two AGB populations are of similar age. Both IC 1613 and NGC 6822 are thought to have undergone almost continuous star formation until now (Cole et al. 1999; Clementini et al. 2003; de Blok & Walter 2006), although there has been no detailed study of the age of the AGB population in either galaxy. However, based on an adopted abundance of Z = 0.001, which is in good agreement with the metallicity we derive, Battinelli & Demers (2009) estimate that the majority of the C-type star population in IC 1613 have ages between 700 Myr and 2.5 Gyr, while Kacharov et al. (2012) suggest that the AGB population of NGC 6822 have ages between 1.0 − 1.5 Gyr based on the fitting of isochrones with metallicities between [ Fe/H ] = − 0.7 to − 1.3 dex. Despite the wide range of metallicities used by Kacharov et al. (2012), the ages derived by Battinelli & Demers (2009) and Kacharov et al. (2012) also suggest that the AGB populations of the respective galaxies are of a similar age.
6. Conclusions
We have used JHK photometry of an area of ~0.80 deg2 centered on the Irr dwarf galaxy IC 1613 to isolate the AGB population of that galaxy, and have derived a global iron abundance based on the C/M ratio of that population. The magnitude of the TRGB has been determined and variations in that magnitude have been investigated as a function of distance from the galactic centre and as a function of azimuthal angle. The C/M ratio and the calculated [Fe/H] values have been investigated as functions of the same parameters.
Below we summarise our main conclusions.
-
1.
The MW foreground population, which for our purposesconstitutes contamination of the desired photometric sample ofIC 1613 giants, has been removed using a colourcut at (J − H)0 = 0.64 mag. This cut has effectively removed the low-level foreground dwarf contamination in the direction of IC 1613, although some contamination is expected to remain due to the imperfect nature of the colour selection; this is estimated to be ~0.80 stars per kpc2.
-
2.
The TRGB magnitude has been measured to be K0 = 18.28 ± 0.15 mag using the Sobel edge-detection algorithm. This value has been used to select AGB stars from the IC 1613 population. Further measurements of the TRGB at different galactocentric distances and as a function of azimuthal angle have not found any trend in the TRGB magnitude with either parameter.
-
3.
Colour selection criteria of 0.75 ≤ (J − K)0< 1.15 mag and (J − K)0 ≥ 1.15 mag have been used to classify M- and C-type AGB stars respectively. The error on the colour boundary at (J − K)0 = 1.15 mag is estimated to be ~0.05 mag. This colour value translates into (J − K)2MASS = 1.22 mag for the photometric system of the 2MASS point source catalogue. A blue limit of (J − K)0 = 0.75 mag has been applied to the M-type star population in order to exclude K-type giant sources and provide a purer M-type sample for our determination of the C/M ratio.
-
4.
Using the measured stellar density in annuli at intervals of 0.5 kpc in the de-projected plane of the galaxy, the density profile of the AGB population has been plotted and traced out to a distance of 6 kpc from the centre of the galaxy. Based on this result we have used only those sources within 4.5 kpc for the determination of the C/M ratio and the [Fe/H] abundance within IC 1613.
-
5.
A C/M ratio of 0.52 ± 0.04 has been derived within the 4.5 kpc radial limit we have imposed. From this value we have calculated an [Fe/H] abundance of − 1.26 ± 0.07 dex, using C/M vs. [Fe/H] relation presented by Cioni (2009). Although we have not been able to incorporate the affects of the stellar age distribution in our calculations, the value we derive is consistent with other population metallicity measurements in the literature and we see very little variation in iron abundance cross the galaxy (Sect. 4.4). For IC 1613 this first-order approximation of the C/M vs. [Fe/H] relation appears to provide a good estimate of the global galactic metallicity.
-
6.
The (J − H) and (J − K) colour distribution of the C-type population has been examined in more detail based on a sample of our photometric sources in common with Albert et al. (2000). Based on our JHK photometry for 145 candidate C-type sources presented by Albert et al. (2000), we find that only 7 have (J − H)0< 0.64 mag. The (J − K) distribution of these sources shows that C-type stars are present on both sides of our colour boundary for the classification of the AGB sources, but that the majority have colours (J − K)0 ≥ 1.15 mag.
-
7.
Based on a comparison with the work of Albert et al. (2000) who relied on the CN − TiO method to classify C-type AGB stars in IC 1613, and the work of Sibbons et al. (2014) who provide an estimate of the error associated with that method, it was estimated that up to 10% of the C-type population in our sample may have been misclassified as M-type stars. Correcting for this potential misclassification in our photometric sample results in a C/M ratio of 0.61 ± 0.04 and [Fe/H] = − 1.29 ± 0.07 dex.
-
8.
In order to preserve the maximum number IC 1613 sources a bluer (J − H) cut was also examined. Using (J − H)0 = 0.58 mag, instead of 0.64, to remove the dwarf foreground sources results a C/M ratio of 0.48 ± 0.04 and an iron abundance of [Fe/H] = − 1.24 ± 0.07 dex. The impact of the change in colour cut is small and the derived iron abundances for each cut are in good agreement. It was decided to use the redder (J − H) cut in order to preserve the purest sample of giant stars.
Acknowledgments
We would like to take the opportunity to thank the referee for his/her detailed reading of this paper and the useful comments provided.
References
- Albert, L., Demers, S., & Kunkel, W. E. 2000, AJ, 119, 2780 [NASA ADS] [CrossRef] [Google Scholar]
- Battinelli, P., & Demers, S. 2009, A&A, 493, 1075 [NASA ADS] [CrossRef] [EDP Sciences] [Google Scholar]
- Battinelli, P., Demers, S., & Artigau, É. 2007a, A&A, 466, 875 [NASA ADS] [CrossRef] [EDP Sciences] [Google Scholar]
- Battinelli, P., Demers, S., & Mannucci, F. 2007b, A&A, 474, 35 [NASA ADS] [CrossRef] [EDP Sciences] [Google Scholar]
- Bellazzini, M., Ferraro, F. R., Origlia, L., et al. 2002, AJ, 124, 3222 [NASA ADS] [CrossRef] [Google Scholar]
- Bernard, E. J., Aparicio, A., Gallart, C., Padilla-Torres, C. P., & Panniello, M. 2007, AJ, 134, 1124 [NASA ADS] [CrossRef] [Google Scholar]
- Bernard, E. J., Monelli, M., Gallart, C., et al. 2010, ApJ, 712, 1259 [NASA ADS] [CrossRef] [Google Scholar]
- Bessell, M. S., & Brett, J. M. 1988, PASP, 100, 1134 [NASA ADS] [CrossRef] [Google Scholar]
- Blanco, B. M., Blanco, V. M., & McCarthy, M. F. 1978, Nature, 271, 638 [NASA ADS] [CrossRef] [Google Scholar]
- Borissova, J., Georgiev, L., Kurtev, R., et al. 2000, Rev. Mex. Astron. Astrofis., 36, 151 [Google Scholar]
- Boyer, M. L., Skillman, E. D., van Loon, J. T., Gehrz, R. D., & Woodward, C. E. 2009, ApJ, 697, 1993 [NASA ADS] [CrossRef] [Google Scholar]
- Boyer, M. L., Girardi, L., Marigo, P., et al. 2013, ApJ, 774, 83 [NASA ADS] [CrossRef] [Google Scholar]
- Brewer, J. P., Richer, H. B., & Crabtree, D. R. 1995, AJ, 109, 2480 [NASA ADS] [CrossRef] [Google Scholar]
- Brewer, J. P., Richer, H. B., & Crabtree, D. R. 1996, AJ, 112, 491 [NASA ADS] [CrossRef] [Google Scholar]
- Carpenter, J. M. 2001, AJ, 121, 2851 [NASA ADS] [CrossRef] [Google Scholar]
- Cioni, M. 2009, A&A, 506, 1137 [NASA ADS] [CrossRef] [EDP Sciences] [Google Scholar]
- Cioni, M., van der Marel, R. P., Loup, C., & Habing, H. J. 2000, A&A, 359, 601 [NASA ADS] [Google Scholar]
- Cioni, M.-R. L., Girardi, L., Marigo, P., & Habing, H. J. 2006, A&A, 448, 77 [NASA ADS] [CrossRef] [EDP Sciences] [Google Scholar]
- Clementini, G., Held, E. V., Baldacci, L., & Rizzi, L. 2003, ApJ, 588, 85 [Google Scholar]
- Cole, A. A., Tolstoy, E., Gallagher, III, J. S., et al. 1999, AJ, 118, 1657 [NASA ADS] [CrossRef] [Google Scholar]
- Cook, K. H., Aaronson, M., & Norris, J. 1986, ApJ, 305, 634 [NASA ADS] [CrossRef] [Google Scholar]
- de Blok, W. J. G., & Walter, F. 2006, AJ, 131, 343 [NASA ADS] [CrossRef] [Google Scholar]
- Demers, S., Battinelli, P., & Artigau, E. 2006, A&A, 456, 905 [NASA ADS] [CrossRef] [EDP Sciences] [Google Scholar]
- Dolphin, A. E., Saha, A., Skillman, E. D., et al. 2001, ApJ, 550, 554 [NASA ADS] [CrossRef] [Google Scholar]
- Feast, M. W., Abedigamba, O. P., & Whitelock, P. A. 2010, MNRAS, 129 [Google Scholar]
- Fishlock, C. K., Karakas, A. I., & Stancliffe, R. J. 2014, MNRAS, 438, 1741 [NASA ADS] [CrossRef] [Google Scholar]
- Freedman, W. L. 1988, AJ, 96, 1248 [NASA ADS] [CrossRef] [Google Scholar]
- Frogel, J. A., Mould, J., & Blanco, V. M. 1990, ApJ, 352, 96 [NASA ADS] [CrossRef] [Google Scholar]
- Georgiev, L., Borissova, J., Rosado, M., et al. 1999, A&AS, 134, 21 [NASA ADS] [CrossRef] [EDP Sciences] [Google Scholar]
- Girardi, L., Bressan, A., Bertelli, G., & Chiosi, C. 2000, A&AS, 141, 371 [NASA ADS] [CrossRef] [EDP Sciences] [Google Scholar]
- Girardi, L., Groenewegen, M. A. T., Hatziminaoglou, E., & da Costa, L. 2005, A&A, 436, 895 [NASA ADS] [CrossRef] [EDP Sciences] [Google Scholar]
- Girardi, L., Williams, B. F., Gilbert, K. M., et al. 2010, ApJ, 724, 1030 [NASA ADS] [CrossRef] [Google Scholar]
- Górski, M., Pietrzyński, G., & Gieren, W. 2011, AJ, 141, 194 [NASA ADS] [CrossRef] [Google Scholar]
- Groenewegen, M. A. T. 2006, in Planetary Nebulae Beyond the Milky Way, eds. L. Stanghellini, J. R. Walsh, & N. G. Douglas (Berlin: Springer), 108 [Google Scholar]
- Groenewegen, M. A. T., Lançon, A., & Marescaux, M. 2009, A&A, 504, 1031 [NASA ADS] [CrossRef] [EDP Sciences] [Google Scholar]
- Gullieuszik, M., Held, E. V., Rizzi, L., et al. 2008, MNRAS, 388, 1185 [NASA ADS] [CrossRef] [Google Scholar]
- Held, E. V., Gullieuszik, M., Rizzi, L., et al. 2010, MNRAS, 404, 1475 [NASA ADS] [Google Scholar]
- Hodge, P. W., Smith, T. R., Eskridge, P. B., MacGillivray, H. T., & Beard, S. M. 1991, ApJ, 369, 372 [NASA ADS] [CrossRef] [Google Scholar]
- Hodgkin, S. T., Irwin, M. J., Hewett, P. C., & Warren, S. J. 2009, MNRAS, 394, 675 [NASA ADS] [CrossRef] [Google Scholar]
- Iben, Jr., I., & Renzini, A. 1983, ARA&A, 21, 271 [NASA ADS] [CrossRef] [Google Scholar]
- Jackson, D. C., Skillman, E. D., Gehrz, R. D., Polomski, E., & Woodward, C. E. 2007a, ApJ, 656, 818 [NASA ADS] [CrossRef] [Google Scholar]
- Jackson, D. C., Skillman, E. D., Gehrz, R. D., Polomski, E., & Woodward, C. E. 2007b, ApJ, 667, 891 [NASA ADS] [CrossRef] [Google Scholar]
- Jung, M. Y., Chun, S.-H., Chang, C.-R., et al. 2009, J. Astron. Space Sci., 26, 421 [NASA ADS] [CrossRef] [Google Scholar]
- Kacharov, N., Rejkuba, M., & Cioni, M.-R. L. 2012, A&A, 537, A108 [NASA ADS] [CrossRef] [EDP Sciences] [Google Scholar]
- Kalirai, J. S., Marigo, P., & Tremblay, P.-E. 2014, ApJ, 782, 17 [NASA ADS] [CrossRef] [Google Scholar]
- Karakas, A. I. 2003, Ph.D. Thesis, Univ. Australia [Google Scholar]
- Lake, G., & Skillman, E. D. 1989, AJ, 98, 1274 [NASA ADS] [CrossRef] [Google Scholar]
- Lee, M. G., Freedman, W. L., & Madore, B. F. 1993, ApJ, 417, 553 [Google Scholar]
- Lee, H., Grebel, E. K., & Hodge, P. W. 2003, A&A, 401, 141 [NASA ADS] [CrossRef] [EDP Sciences] [Google Scholar]
- Letarte, B., Demers, S., Battinelli, P., & Kunkel, W. E. 2002, AJ, 123, 832 [NASA ADS] [CrossRef] [Google Scholar]
- Lozinskaya, T. A. 2002, Astron. Astrophys. Trans., 21, 223 [Google Scholar]
- Madore, B. F., & Freedman, W. L. 1995, AJ, 109, 1645 [NASA ADS] [CrossRef] [Google Scholar]
- McConnachie, A. W., & Irwin, M. J. 2006, MNRAS, 365, 902 [NASA ADS] [CrossRef] [Google Scholar]
- Mouhcine, M., & Lançon, A. 2003, MNRAS, 338, 572 [NASA ADS] [CrossRef] [Google Scholar]
- Nikolaev, S., & Weinberg, M. D. 2000, ApJ, 542, 804 [NASA ADS] [CrossRef] [Google Scholar]
- Palmer, L. G., & Wing, R. F. 1982, AJ, 87, 1739 [NASA ADS] [CrossRef] [Google Scholar]
- Pietrzyński, G., Gieren, W., Soszyński, I., et al. 2006, ApJ, 642, 216 [NASA ADS] [CrossRef] [Google Scholar]
- Saha, A., Freedman, W. L., Hoessel, J. G., & Mossman, A. E. 1992, AJ, 104, 1072 [NASA ADS] [CrossRef] [Google Scholar]
- Sakai, S., Madore, B. F., & Freedman, W. L. 1996, ApJ, 461, 713 [NASA ADS] [CrossRef] [Google Scholar]
- Salaris, M., & Girardi, L. 2005, MNRAS, 357, 669 [NASA ADS] [CrossRef] [Google Scholar]
- Schlegel, D. J., Finkbeiner, D. P., & Davis, M. 1998, ApJ, 500, 525 [NASA ADS] [CrossRef] [Google Scholar]
- Sibbons, L. F., Ryan, S. G., Cioni, M.-R. L., Irwin, M., & Napiwotzki, R. 2012, A&A, 540, A135 [NASA ADS] [CrossRef] [EDP Sciences] [Google Scholar]
- Sibbons, L. F., Ryan, S., Irwin, M., & Napiwotzki, R. 2014, A&A, in press, DOI: 10.1051/0004-6361/201423981 [Google Scholar]
- Skillman, E. D., Kennicutt, R. C., & Hodge, P. W. 1989, ApJ, 347, 875 [NASA ADS] [CrossRef] [Google Scholar]
- Skillman, E. D., Tolstoy, E., Cole, A. A., et al. 2003, ApJ, 596, 253 [NASA ADS] [CrossRef] [Google Scholar]
- Skillman, E. D., Hidalgo, S. L., Weisz, D. R., et al. 2014, ApJ, 786, 44 [NASA ADS] [CrossRef] [Google Scholar]
- Tautvaišienė, G., Geisler, D., Wallerstein, G., et al. 2007, AJ, 134, 2318 [NASA ADS] [CrossRef] [Google Scholar]
- Tikhonov, N. A., & Galazutdinova, O. A. 2002, A&A, 394, 33 [NASA ADS] [CrossRef] [EDP Sciences] [Google Scholar]
- Ventura, P., & Marigo, P. 2010, MNRAS, 408, 2476 [NASA ADS] [CrossRef] [Google Scholar]
- Ventura, P., Criscienzo, M. D., Schneider, R., et al. 2012, MNRAS, 424, 2345 [NASA ADS] [CrossRef] [Google Scholar]
- Whitelock, P. A., Feast, M. W., Marang, F., & Groenewegen, M. A. T. 2006, MNRAS, 369, 751 [NASA ADS] [CrossRef] [EDP Sciences] [Google Scholar]
- Woods, P. M., Oliveira, J. M., Kemper, F., et al. 2011, MNRAS, 411, 1597 [NASA ADS] [CrossRef] [Google Scholar]
- Zijlstra, A. A., Matsuura, M., Wood, P. R., et al. 2006, MNRAS, 370, 1961 [NASA ADS] [CrossRef] [Google Scholar]
- Zucker, D. B., & Wyder, T. K. 2004, Origin and Evolution of the Elements, eds. A. Mc William, & M. Rauch (Pasadena: Carnegie Observatories) [Google Scholar]
All Tables
All Figures
|
Fig. 1 Log number vs. linear magnitude in 0.2 mag bins. The red line shows the magnitude distribution of the TRILEGAL synthesised foreground population in the K-band. |
| In the text | |
|
Fig. 2 Left: colour−magnitude diagram of those sources with a non-stellar classification in both the J- and K-bands. Right: colour−magnitude diagram of those sources that have been selected using the flag criteria discussed in the text. Sources in black are those that meet the three band flag criteria. Sources in green are those that meet the two band flag criteria. |
| In the text | |
|
Fig. 3 Error vs. magnitude for each photometric band. In black are sources that have been classified as stellar or probably-stellar in all three photometric bands. In green are the additional sources that have been classified as stellar or probably stellar in only two photometric bands. |
| In the text | |
|
Fig. 4 Observed area subdivided into a grid of 25 squares each with dimensions of ~10′ × 10′. The high density of sources in the centre is IC 1613. |
| In the text | |
|
Fig. 5 Left: colour−colour diagram of sources from the centre of the observed area which is dominated by IC 1613 sources (black crosses) and sources from the four corner regions of the grid (red crosses) where MW sources are expected to dominate. Only sources with σJ,H,K< 0.1 mag have been shown. The dashed horizontal line at (J − H)0 = 0.64 mag is the primary foreground removal cutoff applied to our sample. The dashed diagonal lines at (J − K)0 = 0.75 and 1.15 mag are the colour criteria used for the selection of C- and M-type AGB candidates (Sect. 3.3). The solid green line shows the trend identified by Whitelock et al. (2006) for Galactic and LMC C-type Mira. Right: a (J − H) colour histogram of the same sources, with bin size 0.02 mag. The solid line histogram represents those sources from the central region, the dashed line represents the corner region sources over an area four times larger than the central region. The solid red line is at (J − H)0 = 0.64 mag. |
| In the text | |
|
Fig. 6 Colour−magnitude diagram of sources from the central grid region (black crosses) and from the four corner regions (red triangles) with (J − H)0 ≥ 0.64. The dashed horizontal line marks the position of the TRGB at K = 18.28 mag (Sect. 3.2). The dashed vertical lines mark the positions of the blue limit (left) and the boundary between the C- and M-type stars (right) (see Sect. 3.3). |
| In the text | |
|
Fig. 7 Smoothed K-band magnitude distribution (dashed line) of the sources in the ~10′ × 10′ central grid region. The Sobel filter (solid black line) has been applied and a Gaussian curve (solid red line) has been fitted to the strongest peak to determine the position of the TRGB magnitude and the associated error. The distribution is a generalised histogram and the vertical scale is arbitrary. |
| In the text | |
|
Fig. 8 (J-K) colour histogram of those sources in the central grid region (Fig. 4) with (J − H)0 ≥ 0.64 mag and brighter than the TRGB magnitude. The vertical dashed lines mark the position of the colour separation imposed here to distinguish between C- and M-type sources at (J − K)0 = 1.15 ± 0.05 mag and the blue limit at (J − K)0 = 0.75 mag (see Sect. 3.3.2). |
| In the text | |
|
Fig. 9 Left: density distribution of the foreground and IC 1613 K-type giant sources removed from the JHK data set as described in Sect. 3.1. Using 1600 bins across the full observed area contours are at 2, 5, 10, 25 and 40 per arcmin2. Right: CMD of all the sources removed as foreground and the K-type giants. The dashed horizontal and vertical lines are the AGB selection criteria discussed in Sect. 3. |
| In the text | |
|
Fig. 10 Top: spatial distribution of the candidate AGB stars in the observed area. Bottom: Log plot of the number of AGB (red triangles) and RGB (black dots) classified sources per kpc2 as a function of distance from the galactic centre. The dashed line at − 0.086 indicates the residual background level brighter than the TRGB, estimated from the four corners of the grid (see Sect. 3.2). |
| In the text | |
|
Fig. 11 Colour−magnitude diagrams of those sources with (J − H)0 ≥ 0.64 mag within each of the annuli between 0 − 1 kpc, 1 − 2 kpc, 2 − 3 kpc and 3 − 4.5 kpc. Foreground stars with (J − H)0 ≥ 0.64 mag will also be present. The dashed horizontal and vertical lines mark the position of the TRGB and our (J − K) classification criteria respectively. |
| In the text | |
|
Fig. 12 Variation of TRGB magnitude as a function of azimuthal angle (top) and as a function of distance from the galactic centre (bottom). In the top panel, the TRGB measurements from only the six inner segments seen in Fig. 13 are shown. In the bottom panel the solid black line shows a weighted linear fit to all the data points, the dashed red line shows a weighted fit to only the first 3 data points. |
| In the text | |
|
Fig. 13 Observed area has been aligned with the PA (58°) of the galactic H I and de-projected using an inclination of 38°. The black crosses show the positions of those sources with (J − H)0 ≥ 0.64 mag. Two circles at radius 2 kpc (9′) and 4.5 kpc (20′) have been imposed and the area divided into 6 segments in each annuli order to examine the TRGB, C/M ratio and [Fe/H] abundance within IC 1613 as a function of angle. The thick red line marks the approximate position of the PA in the de-projected image. |
| In the text | |
|
Fig. 14 Top left panel: C/M ratio as a function of azimuthal angle for each of the segments shown in Fig. 13. The inner segments, 0−2 kpc (red squares), and the outer segments 2−4.5 kpc (black triangles) are shown separately. Bottom panel: C/M ratio as a function of distance from the galactic centre. The solid black line is a weighted linear fit to all four points, the red dashed line is also weighted but is only fitted to the first three points. Right: the same information is presented in the right hand panels for the [Fe/H] abundance, derived from the C/M ratio using the relation of Cioni (2009). |
| In the text | |
|
Fig. 15 Left: colour−magnitude diagram of all the sources (black crosses) in the original photometric data that met the quality flag criterion and have (J − H)0> 0.64 mag. Plotted as coloured squares are those sources that we have in common with Albert et al. (2000), including those we rejected as foreground or due to the quality of their photometry. Sources classified as AGB are in red, those classified as RGB are in green, those classified as foreground are in yellow and those sources that were rejected by the two-flag quality criteria are in cyan. The dashed horizontal line marks the position of the TRGB and the vertical lines mark the (J − K) selection criteria applied in this work. Right: colour histograms, using 0.02 mag bins, showing the (J − H) and (J − K) colour distributions of those sources we have in common with Albert et al. (2000), all of which they have classified as C-type according to the CN − TiO method. |
| In the text | |
Current usage metrics show cumulative count of Article Views (full-text article views including HTML views, PDF and ePub downloads, according to the available data) and Abstracts Views on Vision4Press platform.
Data correspond to usage on the plateform after 2015. The current usage metrics is available 48-96 hours after online publication and is updated daily on week days.
Initial download of the metrics may take a while.