Fig. 15
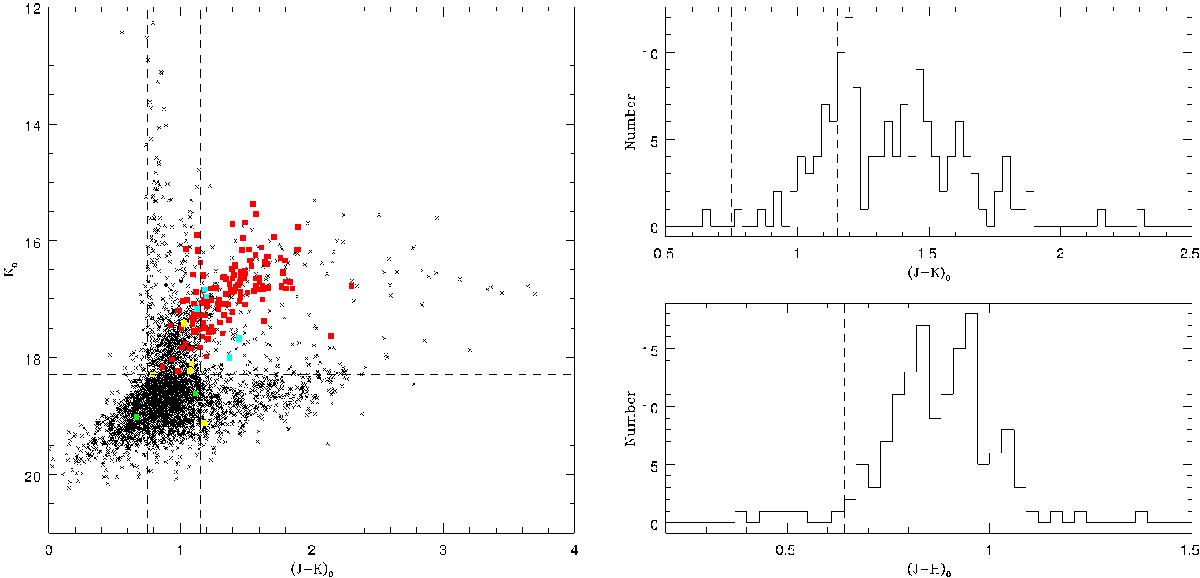
Left: colour−magnitude diagram of all the sources (black crosses) in the original photometric data that met the quality flag criterion and have (J − H)0> 0.64 mag. Plotted as coloured squares are those sources that we have in common with Albert et al. (2000), including those we rejected as foreground or due to the quality of their photometry. Sources classified as AGB are in red, those classified as RGB are in green, those classified as foreground are in yellow and those sources that were rejected by the two-flag quality criteria are in cyan. The dashed horizontal line marks the position of the TRGB and the vertical lines mark the (J − K) selection criteria applied in this work. Right: colour histograms, using 0.02 mag bins, showing the (J − H) and (J − K) colour distributions of those sources we have in common with Albert et al. (2000), all of which they have classified as C-type according to the CN − TiO method.
Current usage metrics show cumulative count of Article Views (full-text article views including HTML views, PDF and ePub downloads, according to the available data) and Abstracts Views on Vision4Press platform.
Data correspond to usage on the plateform after 2015. The current usage metrics is available 48-96 hours after online publication and is updated daily on week days.
Initial download of the metrics may take a while.