Fig. 5
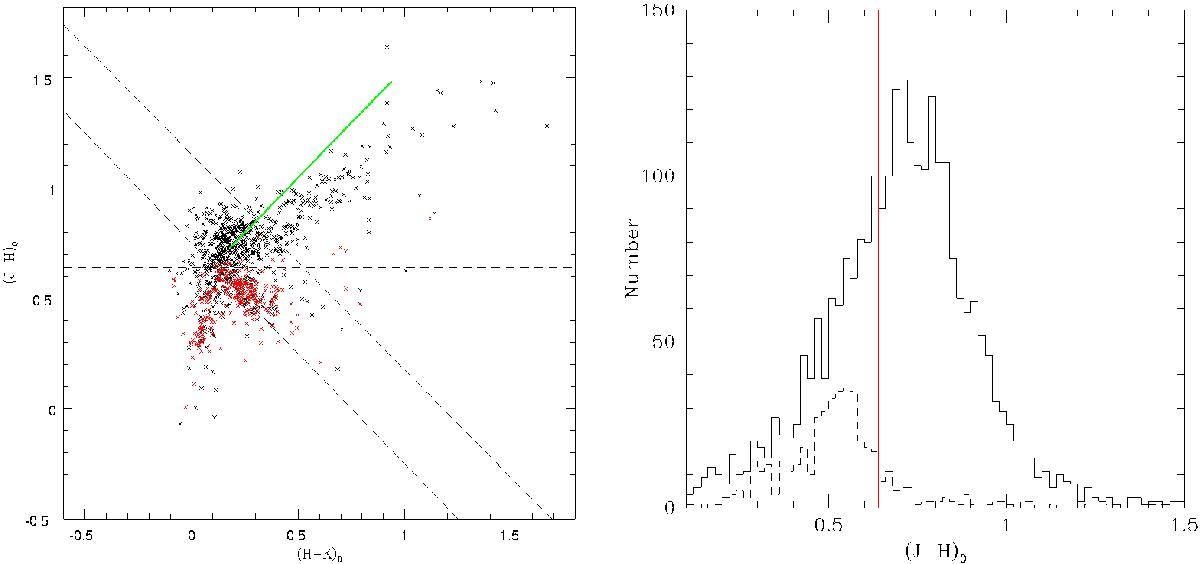
Left: colour−colour diagram of sources from the centre of the observed area which is dominated by IC 1613 sources (black crosses) and sources from the four corner regions of the grid (red crosses) where MW sources are expected to dominate. Only sources with σJ,H,K< 0.1 mag have been shown. The dashed horizontal line at (J − H)0 = 0.64 mag is the primary foreground removal cutoff applied to our sample. The dashed diagonal lines at (J − K)0 = 0.75 and 1.15 mag are the colour criteria used for the selection of C- and M-type AGB candidates (Sect. 3.3). The solid green line shows the trend identified by Whitelock et al. (2006) for Galactic and LMC C-type Mira. Right: a (J − H) colour histogram of the same sources, with bin size 0.02 mag. The solid line histogram represents those sources from the central region, the dashed line represents the corner region sources over an area four times larger than the central region. The solid red line is at (J − H)0 = 0.64 mag.
Current usage metrics show cumulative count of Article Views (full-text article views including HTML views, PDF and ePub downloads, according to the available data) and Abstracts Views on Vision4Press platform.
Data correspond to usage on the plateform after 2015. The current usage metrics is available 48-96 hours after online publication and is updated daily on week days.
Initial download of the metrics may take a while.