Fig. 1
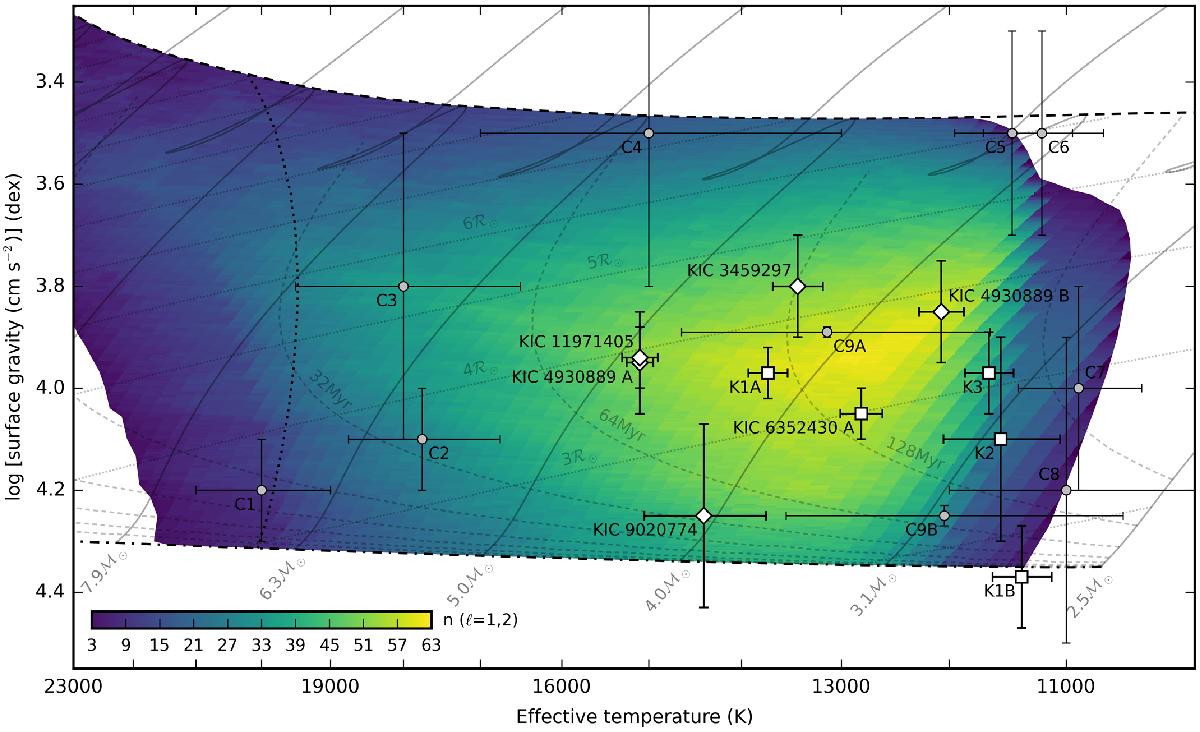
Kiel diagram of a sample of B-type stars near the main sequence, for which an in-depth seismic data analysis is available, observed by CoRoT (circles) and Kepler (squares). The new SPBs from this paper are plotted with diamonds. Stars analysed or revisited in this paper are labelled using their full names, while for the others we use the following annotations: C1 – HD 48977, C2 – HD 43317, C3 – HD 50230 A, C4 – HD 50846 A, C5 – HD 182198, C6 – HD 181440, C7 – HD 46179, C8 – HD 174648, C9 – HD 174884 AB, K1 – KIC 4931738 AB, K2 – KIC 10526294, and K3 – KIC 7760680. The dot-dashed line represents the zero-age main sequence (ZAMS), while the dashed line indicates the terminal-age main sequence (TAMS). The cool edge of the β Cep instability strip is plotted with a dotted line (for the ℓ = 0 modes). The thin grey solid lines denote evolutionary tracks for selected masses. Isochrones from 20 to 28 Myr and isoradii corresponding to integer multiples of the Solar radius are plotted using thin dashed and dotted grey lines, respectively. The instability strip of SPB stars is defined as the region where the sum of excited ℓ = 1 plus ℓ = 2 gravity modes is at least three, and it is shown in colours ranging from purple (3 excited modes) to bright yellow (63 excited modes). All model data were taken from Moravveji (2016) for Z = 0.014, the Asplund et al. (2009) mixture, an exponential core overshoot of fov = 0.02, and opacity enhancement factors for iron and nickel of βFe = 1.75 and βNi = 1.75. Different error bars reflect differences in data quality and methodological approach.
Current usage metrics show cumulative count of Article Views (full-text article views including HTML views, PDF and ePub downloads, according to the available data) and Abstracts Views on Vision4Press platform.
Data correspond to usage on the plateform after 2015. The current usage metrics is available 48-96 hours after online publication and is updated daily on week days.
Initial download of the metrics may take a while.